Gold prices in the short term continue to look overall bearish. Old news, which is being twisted into new headlines, is once again front and center. Spain, Italy, Iran, the US economy, quantitative easing and the old economic issues in America, Europe and China remain the dominant stories of the day.
Spain had taken over news headlines as the markets focused on the interest rates Spain is being forced to pay to borrow funds. Anything over 6% in ten year Spanish notes is considered the line in the sand. Luckily Spain did not have to pay that today. Anything beyond 6% is what the market considers to be too high of an interest rate for Spain to be able to pay and turn its economy around. Interest rates poked their head over that amount on Tuesday, but today's action went at 5.4%. This amount is still 25 bps more than Spain paid several months ago.
IMFs Legarde said today that there is no need for IMF help for Spain at the moment, but she made it clear that help is clearly going to be there if needed. A new problem now surfacing is a downgrade by Moody's of French sovereign debt. The rumor of this started via a research note released Wednesday by Citi analysts who said they believed Moody's Investors Service Inc. would put France's triple-A rating "on review for a possible downgrade by the autumn." Autumn is around the corner.
Since my last report, gold has stayed range bound. The range of roughly $1680 down to today's low of $1631.2 is what I'm talking about. Copper prices have been collapsing. This collapse leads me to believe that inflation is not a theme as copper is used in construction of infrastructure of practically all types. Roads, buildings, housing and so on. With prices in a tailspin it's hard to argue inflation in metals.
Energy prices haven't offered much support to gold as they too have stayed range bound. Iran also isn't much of a factor since they were just given another 5-weeks before another meeting with them is set to take place.
Last, the US economy is not showing the robustness it did last quarter. The NY Fed and Philly Fed Reports both recently released showed slowdowns in their respective regions. Today we saw the number of Initial Weekly Jobs Claims decline, but the decline is a camouflage since the decline is from a sharp revision higher. Last week's expectation was for a number of 355K. Instead, the number came out at 380K. That number was revised today to 388K and from there we got a 2K reduction down to 386K today. So that leaves open the question of whether the job bump seen last month had to do with record warm weather, which pulled job employment forward. If so and we don't see job claims decline, the Fed would have the ammunition it needs to enact another round of stimulus, which would be bullish gold.
What gold is lacking right now is a story.
Seasonal Charts
The chart below is published with permission of the Moore Research Center, Inc.
For simplicity purposes, I have only published what a Bull Year looks like given that there's no reason to yet consider a Bear Year in my opinion.
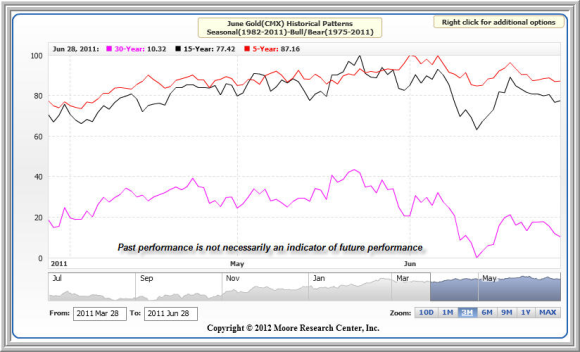
The "seasonal chart" shows the June contract sideways to lower prices in April, leading to a rally in May and break into June.
Monthly Chart
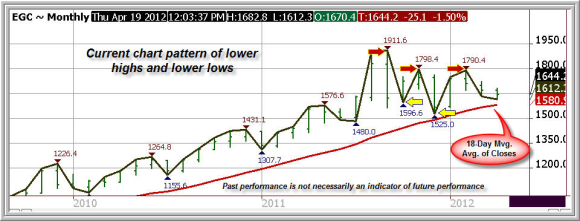
The Monthly chart pattern above is neutral to bearish as the Swingline Study continues to make lower highs (red arrows) and lower lows (yellow arrow). My guess is that if the market continues to work lower, it will find initial support against the 18-Month Moving Average of Closes, 1580.9.
In order for the current monthly chart pattern to turn its Swingline Study neutral (the study that shows the highs and lows on the above chart) prices would have to take out this week's high of 1682.8. Until that occurs, I look for prices to work lower.
The one positive here is that very long term traders who use moving averages are probably looking at the 18-Week Moving Average of Closes and thinking that prices haven't weakened enough in the whole time frame shown, to even get down and touch this chart study. That in itself is bullish and probably has longer term traders closing watching prices to see if this moving average is hit.
Weekly Chart
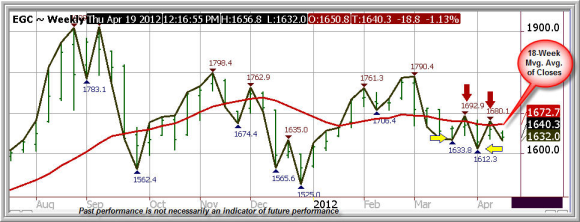
The Weekly Chart is bearish. Prices are in a price pattern of lower highs, lower lows and are trading under the 18-Week Moving Average of Closes. It would take a move over 1680.1 on this chart to reverse this pattern.
This means that the Swingline Study is bearish on both the Monthly and Weekly Chart patterns and that the Weekly Chart, which is of one of a shorter term then the Monthly Chart, is clearly in the Bear camp.
Daily Chart
The Daily Chart is the shortest term chart I use and is the one most traders use.
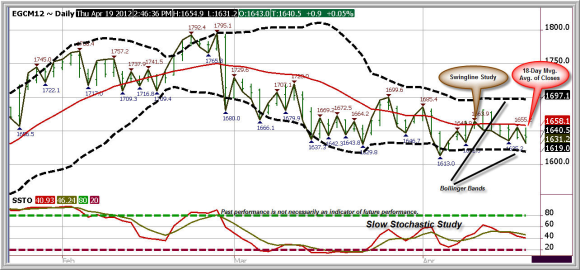
On the Daily Chart shown below I added the momentum study, Slow Stochastics and an algorithm study that looks for support and resistance zones, Bollinger Bands.
This chart is bearish as is the Weekly Chart. The Bollinger Bands have done a nice job of alerting traders to where potential support lies. 1619 is the current price level where charts support is shown.
Should prices get over 1655.2 there would be reason to believe that the chart pattern is changing to one of bullishness. However, that's not the case at this time. In fact the current pattern is bearish given that the chart pattern is now one of lower highs and lower lows as displayed by the Swingline Study.
Summary
In my last report I said that I saw no reason to not remain bearish because prices were in and orderly downtrend. While a rally attempt did take place over the past two weeks, it failed and the current trend remains down.
I also said in my last report that I was looking for $1580 on the downside. I think that the $1620 level now fits in better because on the Daily Chart this is the Bollinger Band Bottom. There's no magic to Bollinger Bands other than they offer support and resistance points as well as doing a good job of telling you when prices might be getting ahead of themselves.
Both the Weekly and Daily Charts are in downtrends. The Monthly Chart has a bearish bias due to the Swingline being in a downtrend, but prices on that chart remain over the 18-Month Moving Average of Closes, which comes in at 1580.9 and is where I thought major support in my last report would come in. That number could still be seen, but to do so means that on the Daily Chart gold would have to widen its current Bollinger Bands by breaking through the bottom band to force the band to move lower.
I don't see reason for gold to accelerate sharply down at this point, so unless something of consequence occurs, I think the Bollinger Band Bottom is all I would be playing for on this leg down.
The bigger problem is that gold doesn't have a pressing bull story going for it right now. Yes, all the problems that will in my opinion ultimately drive higher are there, but timing is important and right now the trend is down. Until the trend turns up, treat the market as short term bearish, with $1620 down to $1581 as downside targets.
If prices get over 1655.2, the game plan changes.
Gold's 10-Ounce Gold Contract
Gold trades in 100 oz., 33 oz. and 10 oz. contracts. The margins for each are based on what the 100 ounce contract is set at. Margins can and do change so we keep our website updated as best we can. You can click here to see what current metal margins are. http://www.iraepstein.com/trading-info/snapshot-margin-page.html
A 10-Ounce Gold Contract
As gold increases in price, so does its margin. Higher margins often give cause to trade in a smaller sized contact.
For those that want to trade a smaller size contract to trade or build positions with, this one may fit the bill. Margins are 1/10th the size of a full size contract.
I intend on using this contract in my trade recommendations, after it builds more of a following.