In this update I am not going to repeat the points made in the last fairly comprehensive update, instead we are going to focus on the importance of the resistance level just above where the price is now, and impact of the killing of the Iranian general and its potential implications for the gold price.
On the latest 10-year chart we can see that gold is making a second attack on the key major resistance level in the $1530-$1560 zone, which is hardly surprising considering what happened last week.

The reason that this resistance level is of such major importance is made abundantly clear by the following chart made by a subscriber and kindly forwarded to me, which I reproduce with his permission. As we can see gold made no less than five significant lows at this level between 2011 and 2013, before it finally crashed this support and plunged 15% in 2 days, so it is clearly of huge significance and is the biggest hurdle by far on the way up. Therefore, even given the latest mayhem in the Mideast, we should not be surprised if it now stalls out here and possibly backs off for a while to form a trading range, which is also made likely by its now being critically overbought on its RSI indicator and by the latest COTs, which we will look at lower down the page, coming in with really extreme readings again. This makes sense given that we now at a time of maximum tension.
From a subscriber—highlighting gold's key support at the $1530-$1560 level, which is now of course strong resistance.

Detail showing the plunge that was triggered the failure of this support.

On the 6-month chart we can see how, after breaking out of the corrective downtrend in force from early September, gold has risen steeply, without one down day so far to become critically overbought on its RSI indicator as it drives into the zone of strong resistance with volume becoming heavy on Friday. This of course increases the chances of its reacting back the moment tension over the Mideast situation eases, even if only slightly.

As for the COTs, they are showing extreme readings once more (chart is for 24th December), which suggest that, especially if tension over the Iran situation eases short term, gold will probably back off some into a consolidation pattern that will enable it to charge up sufficiently to take out the key resistance in due course.

Click on chart to pop-up a larger, clearer version.
Now we come to the possible impact of the U.S. killing of the top Iranian general. In order to figure out the real motivation for this act, we simply have to ask the usual question, "Who stands to gain?" The first interest group that stands to gain is the U.S. military, which receives about $700 billion of taxpayers' money every year, and probably about $500 billion of this is in excess of what it needs to defend the homeland. So in order to justify this bloated budget it creates enemies and conflicts around the world. The next interest group is Israel, which controls the U.S. and uses the U.S. military as a sledgehammer to achieve its objectives, which include dominance of the Mideast. Iran is the big prize. Finally the Republicans and Trump himself stand to gain at the polls later this year as the population will predictably "rally round the flag" as a result of conflict with Iran. Knowing all this, we can quickly deduce that the killing of the Iranian general was an act of extreme provocation designed to trigger some kind of counterattack by Iran that can then be used as an excuse to launch a bombing campaign against it. Even if Iran exercises maximum restraint and does nothing beyond making empty threats to assuage its angry populace, it may still fall victim to an onslaught after a calculated false flag attack that is blamed on it. So whatever it does, it loses; it's been put in a classic "zugzwang" situation.
It is clear that the killing of the Iranian general is the prelude to a military strike against Iran, which will probably take the form of an extensive and intensive bombing campaign that both Israel and the U.S. have been looking forward to for years, because a ground invasion is out of the question due to the geography and logistics. The goal as usual will be to destroy its military capability and wreck its infrastructure with the eventual aim of installing a puppet government and opening up the country to Western exploitation, and the wild card in all this will be whether Russia and China will do anything to prevent it, or just stand and watch. It is thought that they don't have the nerve to intervene. In any event, if such a campaign is launched, we can expect the world to be gripped by an acute sense of crisis and gold will spike. Iran may have the ability to disrupt the flow of oil out of the Persian Gulf, albeit temporarily, which would trigger an oil price spike and a stock market crash.
Last week's updates concluded with a look at the highly bullish charts for gold measured against the Australian dollar and the Japanese yen, and this week we will look at gold against the Canadian dollar and the Swiss franc.
While many investors are still agonizing about whether gold is in a bull market or not, that is because they are fixated on the charts for gold in U.S. dollars. When you look at gold in other currencies you realize that it is already very much in a bull market, and recently made new highs against many currencies, like the Canadian dollar shown below.

Even against the Swiss franc, which amongst currencies enjoys some safe haven status, gold is performing better than it is against the dollar.
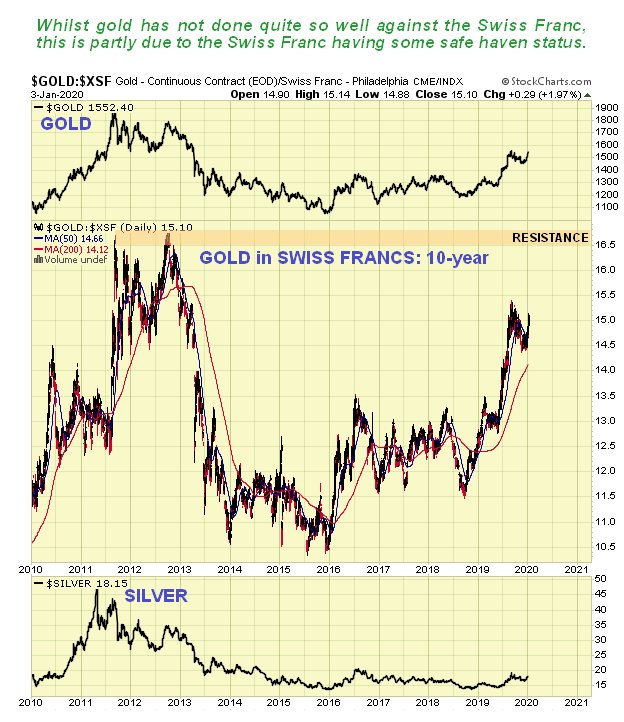
And we should remember that the dollar may not remain as "king of the hill" forever, especially as a number of major powers in the Asia especially are preparing to ditch it.
Finally, we are going to take a quick look at an unusual chart for gold submitted by the same subscriber as some of the charts above. It is unusual because it is a yearly candlestick chart, meaning that each candle on it is for an entire year. Its supreme advantage is that it keeps things simple. The Triangle shown on it is his interpretation, not mine. It certainly looks positive here with a big white candle for 2019, with the arithmetic version shown looking even more bullish. This type of chart also has a potential advantage for the writer, as if only this chart were used, I would only have to write these updates once a year.


Click on charts to pop-up larger, clearer versions.
Article originally published on CliveMaund.com on Sunday, January 5, 2020.
Clive Maund has been president of www.clivemaund.com, a successful resource sector website, since its inception in 2003. He has 30 years' experience in technical analysis and has worked for banks, commodity brokers and stockbrokers in the City of London. He holds a Diploma in Technical Analysis from the UK Society of Technical Analysts.
[NLINSERT]Disclosure:
1) Statements and opinions expressed are the opinions of Clive Maund and not of Streetwise Reports or its officers. Clive Maund is wholly responsible for the validity of the statements. Streetwise Reports was not involved in the content preparation. Clive Maund was not paid by Streetwise Reports LLC for this article. Streetwise Reports was not paid by the author to publish or syndicate this article.
2) This article does not constitute investment advice. Each reader is encouraged to consult with his or her individual financial professional and any action a reader takes as a result of information presented here is his or her own responsibility. By opening this page, each reader accepts and agrees to Streetwise Reports' terms of use and full legal disclaimer. This article is not a solicitation for investment. Streetwise Reports does not render general or specific investment advice and the information on Streetwise Reports should not be considered a recommendation to buy or sell any security. Streetwise Reports does not endorse or recommend the business, products, services or securities of any company mentioned on Streetwise Reports.
3) From time to time, Streetwise Reports LLC and its directors, officers, employees or members of their families, as well as persons interviewed for articles and interviews on the site, may have a long or short position in securities mentioned. Directors, officers, employees or members of their immediate families are prohibited from making purchases and/or sales of those securities in the open market or otherwise from the time of the interview or the decision to write an article until three business days after the publication of the interview or article. The foregoing prohibition does not apply to articles that in substance only restate previously published company releases.
Charts and graphics provided by the author.
CliveMaund.com Disclosure:
The above represents the opinion and analysis of Mr Maund, based on data available to him, at the time of writing. Mr. Maund's opinions are his own, and are not a recommendation or an offer to buy or sell securities. Mr. Maund is an independent analyst who receives no compensation of any kind from any groups, individuals or corporations mentioned in his reports. As trading and investing in any financial markets may involve serious risk of loss, Mr. Maund recommends that you consult with a qualified investment advisor, one licensed by appropriate regulatory agencies in your legal jurisdiction and do your own due diligence and research when making any kind of a transaction with financial ramifications. Although a qualified and experienced stock market analyst, Clive Maund is not a Registered Securities Advisor. Therefore Mr. Maund's opinions on the market and stocks can only be construed as a solicitation to buy and sell securities when they are subject to the prior approval and endorsement of a Registered Securities Advisor operating in accordance with the appropriate regulations in your area of jurisdiction.


