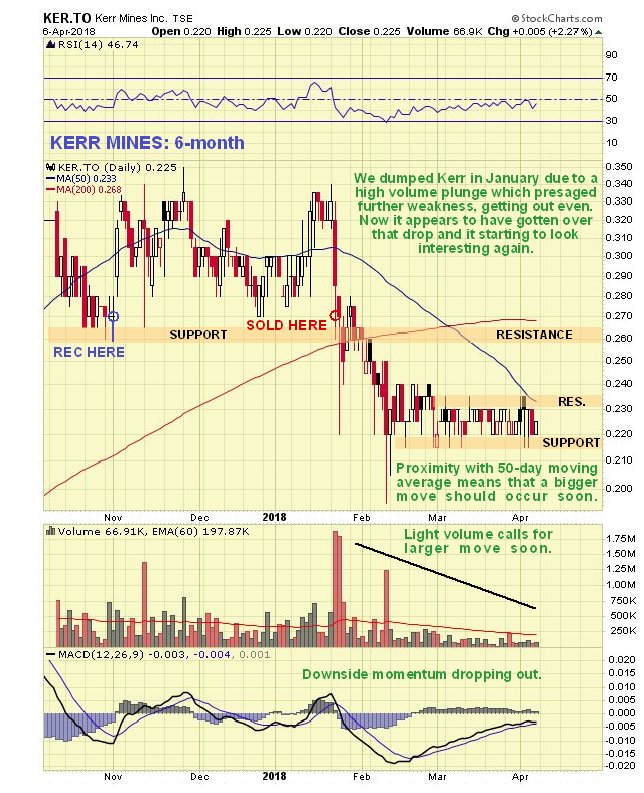
We ditched Kerr Mines Inc. (KER:TSX; KERMF:OTC; 7AZ1:FRA) back in January after it started to drop sharply on very heavy volume, which suggested that the stock would drop further and be "under a cloud" for a while, and such has proven to be the case. We got out about even.
Now, however, after a due period of convalescence, there are signs that it may soon start higher again. On its latest 6-month chart we can see where we last bought, where we sold at about the same price, and then how it continued to drop after we sold, before running off sideways into an increasingly tight horizontal trading range. The challenge for us is to figure whether this narrow range is a consolidation pattern that will be followed by another drop, or an intermediate base pattern that will be followed by renewed advance. On the negative side, the falling 50-day moving average has now caught up with the price and could force another drop, especially as the earlier oversold condition has now unwound. However, various other factors suggest that it will instead break out upside from this range. First, although the 50-day moving average has dropped down close to the price and is pressuring it from above, it is very clear that it will quickly turn up if the price should break to the upside. Second, although the oversold condition has unwound, opening up downside potential again, the MACD indicator easing and closing on the zero line also shows that downside momentum has largely dropped out, so it's a double edged thing. The dwindling volume could also lead to a break in either direction.
Alright, so what other clues are there regarding which way it is going to break? A bullish one is that the price is well below a still about flat 200-day moving average, which is a measure of how oversold it still is. Another positive indication is the long-tailed candles early in February showing underlying support, but perhaps the most important positive indication is the steadily rising Accumulation line shown at the top of our second 6-month chart below. It is already at all-time highs and it strongly suggests that Kerr is under accumulation and that the pattern will resolve with a break to the upside, and of course it should certainly be empowered if gold breaks out of its large Head-and-Shoulders bottom pattern, which is becoming more and more likely with passing time. That a big move should occur soon in Kerr is made obvious by the Bollinger Bands shown on this second 6-month chart, which are tightly pinched together showing conditions of excessive calm that cannot last.

To grasp the big picture of what is going on in Kerr we will now look briefly at its long-term charts. Starting with the 5-year chart we see that a bull market started in the stock from a very low level back early in 2016, and the reason that it reacted back more heavily in recent months was that after big percentage gains it had accelerated towards a zone of considerable resistance that is shown on this chart—it needed a rest and it has had one. Notice again that despite the reaction the Accumulation line has continued to march higher, indicating a high probability that Kerr will soon turn higher again.

Lest you should think that Kerr was getting expensive during the latter part of last year, take a look at the 10-year chart where you will see that it was actually still very cheap historically, and is even cheaper now after its reaction, for back in 2011, when gold peaked, it got as high as about C$8.20, which is about 37 times the current price!! So it shouldn't take much effort of the imagination to figure what is likely to happen to it if gold should embark on another strong bull market uptrend, and here it is worth noting that the estimates of the magnitude of Kerr's reserves have about doubled in recent months, which the market yawned at, but it won't be yawning if gold takes off higher again.

Conclusion: weighing it all up, it looks like Kerr will break to the upside soon from the current tight range, and it is therefore rated a strong buy here. Because this range is tightly defined it is possible to place a close stop in case this interpretation is proven incorrect, although this risks being whipsawed out. Bear in mind that there is a fair chance that it will break below the nearby support shown briefly and then reverse dramatically to the upside, with the chance of this happening being increased by the long-tailed candles early in February, which show where the underlying support is.
Kerr Mines website.
Kerr Mines Inc, KER.TSX, KERMF on OTC, closed at C$0.225, $0.172 on 6th April 2018.
Clive Maund has been president of www.clivemaund.com, a successful resource sector website, since its inception in 2003. He has 30 years' experience in technical analysis and has worked for banks, commodity brokers and stockbrokers in the City of London. He holds a Diploma in Technical Analysis from the UK Society of Technical Analysts.
Read what other experts are saying about:
Want to read more Gold Report articles like this? Sign up for our free e-newsletter, and you'll learn when new articles have been published. To see a list of recent articles and interviews with industry analysts and commentators, visit our Streetwise Interviews page.
Disclosure:
1) Clive Maund: I, or members of my immediate household or family, own shares of the following companies mentioned in this article: None. I personally am, or members of my immediate household or family are, paid by the following companies mentioned in this article: None. My company has a financial relationship with the following companies mentioned in this article: None. CliveMaund.com disclosures below. I determined which companies would be included in this article based on my research and understanding of the sector.
2) The following companies mentioned in this article are billboard sponsors of Streetwise Reports: Kerr Mines. Click here for important disclosures about sponsor fees. As of the date of this article, an affiliate of Streetwise Reports has a consulting relationship with Kerr Mines.
3) Statements and opinions expressed are the opinions of the author and not of Streetwise Reports or its officers. The author is wholly responsible for the validity of the statements. The author was not paid by Streetwise Reports for this article. Streetwise Reports was not paid by the author to publish or syndicate this article. The information provided above is for informational purposes only and is not a recommendation to buy or sell any security. Streetwise Reports requires contributing authors to disclose any shareholdings in, or economic relationships with, companies that they write about. Streetwise Reports relies upon the authors to accurately provide this information and Streetwise Reports has no means of verifying its accuracy.
4) This article does not constitute investment advice. Each reader is encouraged to consult with his or her individual financial professional and any action a reader takes as a result of information presented here is his or her own responsibility. By opening this page, each reader accepts and agrees to Streetwise Reports' terms of use and full legal disclaimer. This article is not a solicitation for investment. Streetwise Reports does not render general or specific investment advice and the information on Streetwise Reports should not be considered a recommendation to buy or sell any security. Streetwise Reports does not endorse or recommend the business, products, services or securities of any company mentioned on Streetwise Reports.
5) From time to time, Streetwise Reports LLC and its directors, officers, employees or members of their families, as well as persons interviewed for articles and interviews on the site, may have a long or short position in securities mentioned. Directors, officers, employees or members of their immediate families are prohibited from making purchases and/or sales of those securities in the open market or otherwise from the time of the interview or the decision to write an article, until one week after the publication of the interview or article. As of the date of this article, officers and/or employees of Streetwise Reports LLC (including members of their household) own securities of Kerr Mines, a company mentioned in this article.
Chart provided by the author.
CliveMaund.com Disclosure:
The above represents the opinion and analysis of Mr Maund, based on data available to him, at the time of writing. Mr. Maund's opinions are his own, and are not a recommendation or an offer to buy or sell securities. Mr. Maund is an independent analyst who receives no compensation of any kind from any groups, individuals or corporations mentioned in his reports. As trading and investing in any financial markets may involve serious risk of loss, Mr. Maund recommends that you consult with a qualified investment advisor, one licensed by appropriate regulatory agencies in your legal jurisdiction and do your own due diligence and research when making any kind of a transaction with financial ramifications. Although a qualified and experienced stock market analyst, Clive Maund is not a Registered Securities Advisor. Therefore Mr. Maund's opinions on the market and stocks can only be construed as a solicitation to buy and sell securities when they are subject to the prior approval and endorsement of a Registered Securities Advisor operating in accordance with the appropriate regulations in your area of jurisdiction.


