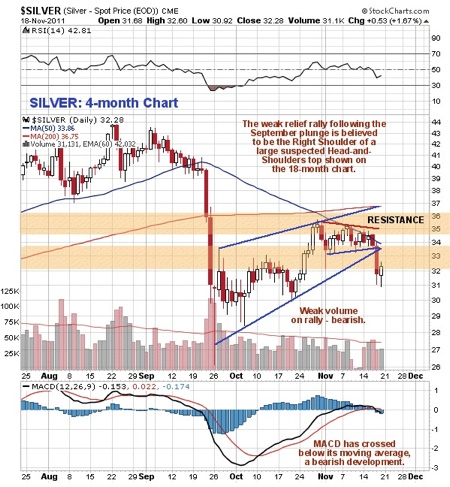
On the four-month chart for silver we can examine recent action in detail. In the light of the latest thinking the rally from late September following the brutal plunge is now viewed as a weak relief rally, which failed on Thursday with a breakdown, which was anticipated on the site with a warning being given, and for a break lower by the broad stock market. Volume on this rally was weak, and after struggling beneath heavy resistance centered on $35 and its falling 50-day moving average for more than 2 weeks, silver broke down from the uptrend in force from late September. The MACD has dropped down through its moving average, which is a bearish development. We cannot hope to grasp the big picture of what is going on in silver on a 4-month chart, so now we will look at an 18-month chart.
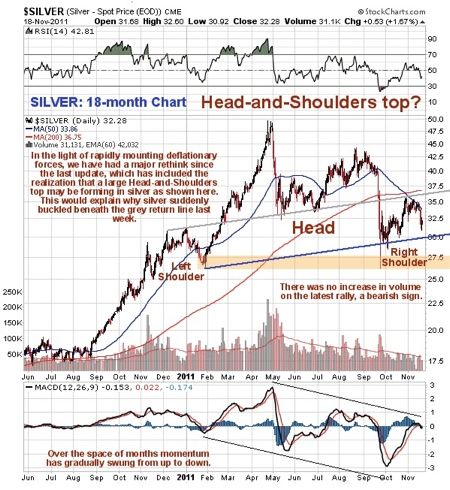
The 18-month chart for silver shows all of the action from the start of the big ramp that began in August of 2010. Earlier thinking was that as a 3-wave decline, involving 2 crashlets, had completed by the September low, a new 5-wave major uptrend would follow, and of course it would if politicians obliged with a globally coordinated QE campaign, but unfortunately it doesn't look like they are going to get that together and we are instead looking at the specter of a deflationary implosion triggered by the collapse of Europe. This realization has prompted a reexamination of the charts, which has led to the discovery of a large head-and-shoulders top in silver completing above an up-sloping neckline as shown. Other technical factors suggesting that an H&S top is indeed completing are the volume pattern—there was no increase in volume at all on the latest rise to mark out the right shoulder of the pattern and a particularly ominous development is the strongly down trending MACD indicator which is showing that the major trend is swinging steadily from up to down—and we are already firmly in down territory.
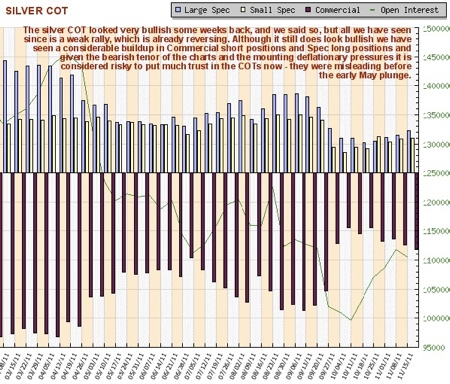
A reason for our bullishness in the recent past was the COT charts, which showed a very low commercial short and large spec position. However, the COT has deteriorated in recent weeks with little to show for it in the way of a rally. Currently it still looks rather bullish, and it is difficult to reconcile this with the bearish picture we have just described which correlates with the potential for a brutal collapse in world stock markets associated with deflationary forces coming to the fore again.