In an economy where uncertainty is the new norm and speculation is a more dangerous game than usual, investors are gravitating toward income-generating investments. However, it's not only the current economy that's pushing investors toward defensive stocks. As U.S. baby boomers retire, they tend to reduce the risk levels in their investments and move toward steady-as-she-goes, income-generating stocks.
Unfortunately, those two forces also mean that many of these defensive stocks are trading between 14 to 20 times forward earnings, putting them at the higher end of their historical range. More on that in a bit.
Factors We Look For
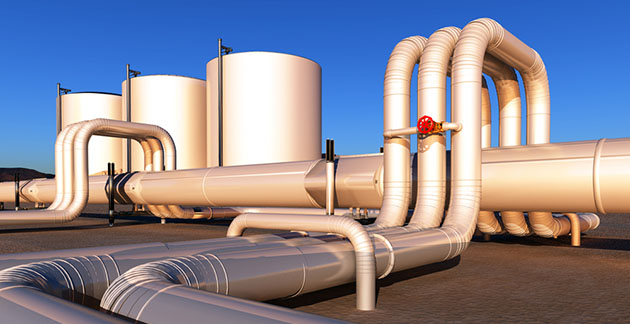
The entire existence of these companies is premised upon their pipelines, so not surprisingly it's their assets we investigate first. Here are some questions we ask:
1. How old are their pipelines? This is a slightly controversial question, because the industry has long held that a well-maintained pipeline should last forever. But a recent spate of spills challenges that claim.
Much of North America's massive oil transportation system is decades old. Specifically, 41% of the oil pipelines in America were built in the 1950s and 1960s; another 15% are even older than that. And many of these old pipelines were built using protective coatings that have since been shown to break down over time.
For example, in July 2010, Enbridge dealt with the biggest spill in the company's history when a six-foot gash in one of its main crude lines in Calhoun Country, MI let some 20,000 barrels of oil escape. The broken pipe had a polyethylene coating to protect it from corrosion—a common technique in the 1950s and 1960s, but investigators found "surface cracks and indications of corrosion."
Granted, sensor technology has reduced the frequency of spills from crude pipelines by 35% since the 1980s. But the Enbridge spill may be a harbinger of problems to come. Over the last year in the United States, three natural-gas pipeline explosions have killed 14 people. Furthermore, the National Transportation Safety Board—whose pipeline investigation team comprises just four people—is swamped.
All told, it's likely that the miles and miles of 50- to 60-year-old pipeline laid out across North America may need major retrofitting in the coming years, meaning major expenses for owners.
2. What plans does the company have for new projects? New projects provide growth and therefore the opportunity for increasing value. However, they also come entangled with long permitting processes that carry no guarantees of success, and a permit denial can mean the loss of significant capital investments. Updated regulations also mean new lines have higher operating costs than older lines.
3. And the universal question, especially these days: How much debt does the company carry? Debt is often a necessity in business, but a company's debt levels must be reasonable compared with its cash and its expected income.
The Search Is On
So with these characteristics in mind, we set off searching. We compiled a list of all the pipeline companies listed in the United States with a market capitalization of at least US$1 billion. Then we gathered a series of data on each: cash on hand, debt, 52-week price range, price-to-earnings ratio, all the basic information. We also calculated another ratio, known as EV/EBITDA.
EV stands for "enterprise value," a measure of a company's value calculated as market capitalization plus debt, minority interest, and preferred shares, minus total cash and cash equivalents. Since it incorporates key information about cash and debt in addition to market price, we consider it a more accurate representation of a company's value than straightforward market capitalization (share price multiplied by number of shares).
EBITDA is a pretty good indicator of financial performance. It stands for "earnings before interest, taxes, depreciation, and amortization"—in short, earnings before the company's accountants and tax lawyers start fiddling with the numbers. Put a little more politely, analysts often use EBITDA to compare profitability between companies because it eliminates the effects of financing and accounting decisions, giving a better idea of straight asset performance.
The ratio of the two—EV divided by EBITDA—compares a company's value with its ability to service its debt. Value versus debt—that incorporates the key factors we outlined. Like all metrics, it's not perfect—for example, EBITDA does not take into account the cash required to fund working capital nor to replace old equipment. But for infrastructure-heavy companies—like the pipeline owners we are assessing—EV/EBITDA is one of the better screening tools that we have available.
So here are our options, in a chart showing their EV/EBITDA ratios:
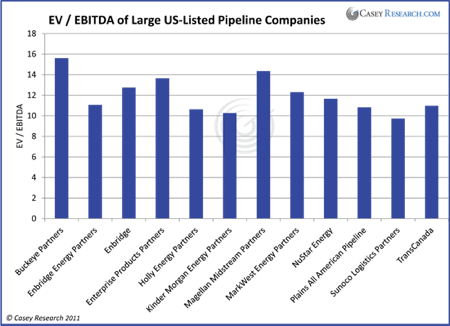
We're looking for a low ratio, because a low EV could mean a company is undervalued, while a high EBITDA indicates good profitability and ability to service debt. With that knowledge, which one stands out? The problem is that none of them do! These companies are virtually all trading at the sector average or above. We'd like to see an EV/EBITDA ratio in the range of 6 to 8. The lack of deviation is in fact remarkable, but unfortunately for us that means there are no good deals.
The best-ish options are Holly Energy Partners (NYSE.HEP), Kinder Morgan Energy Partners (NYSE.KMP), and Sunoco Logistics Partners (NYSE.SXL). If any of their share prices slip appreciably in the ongoing economic storm, we'll re-evaluate these (and look at other metrics) to see whether one of them becomes attractive. For now, they're all too pricey, and we recommend you steer clear.
[With the days of cheap oil numbered, energy companies that power the world offer some of the best investment opportunities moving forward. Read this free report to discover how you can get started.]


