Depending on your trading style, you may be viewing the recent market action as the beginning stages of a bear market (major selloff). A bear market is not necessarily impossible as the U.S. economy is showing the beginning signs of weakness. The fact that stocks have moved lower for almost 6 weeks straight is a recent reminder that we may not be out of the woods just yet. The recent price action and negative sentiment has been harsh enough to make 99% of traders bearish.
In contrast, some traders may be seeing this market as an oversold dip preparing for a bounce/rally in the bull market that we've been in since 2009. Some traders may see this as a buying opportunity because they are contrarians. Most contrarians generally want to do the opposite of the masses (herd) who are merely trading purely out of emotional sentiment.
I myself have mixed thoughts on the market at this point. I'm not a big-picture (long trend forecasting) kind of guy but my trading partner, David Banister, is great at it. Rather I am a shorter-term trader catching extreme sentiment shifts in the market with trades lasting 3–60 days in length. So looking forward two to five days, I feel as though stocks and commodities are going to bottom and start to head higher for a 2%–6% bounce. At that point, we need to regroup and analyze how the market got there. Where are the key resistance levels; did we break through any?
During extreme sentiment shifts in the market, we tend to see investments fall out of sync with each other for a few days. I feel the attention will be on stocks and we get a bounce this week. I am expecting commodities to trade relatively flat during the same period.
OK, let's take a quick look at the charts. . .
Dollar Index 4-Hour Candles
I feel as though the U. S. dollar is trying to bottom. It is very possible that we test the May low at which point I would expect another strong bounce and possible multimonth rally. So, if the dollar drops to the May lows, we should see higher stocks and commodities; but, once the dollar firms up and heads higher, it will be game over for risk assets.

Crude Oil Chart: Daily
Oil took a swan dive in early May and has yet to show any signs of moving higher. Actually, crude oil is looking more and more bearish as time goes by.

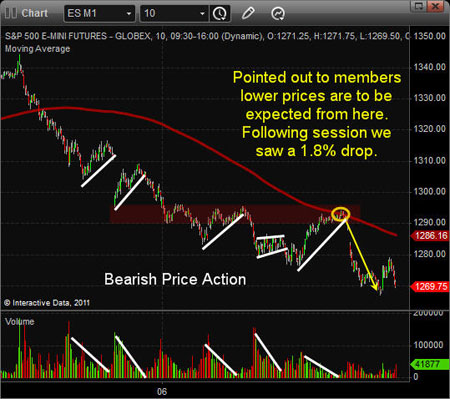
SP500 Futures: 10-Minute Chart Going Back 8 Days
Last week, the SP500 continued to show signs of weakness. Any bounce in the market was on light volume and that is because the sellers took a break and let all the small traders buy the market back up. But once the market moved up enough then sellers jumped back in and unloaded their shares.
Last Thursday, I sent out an update to members pointing out that lower prices were to be expected. I came to this conclusion because of many data points. Looking at the chart, you can see sellers are clearly in control. The SP500 bounces high enough that it reached a key resistance levels going back 5 days. Also, the 200 period moving average was at that level. To top that off, my sentiment reading for the herd mentality was at a point at which sellers like to start dumping their shares again.

Weekly Market Trading Conclusion
I'm getting more bullish for a bounce as the market falls. But once we are into day three or four of a bounce, we must be ready to take profits and/or look for a possible short setup.
Get my free weekly reports here.
Chris Vermeulen
www.thegoldandoilguy.com


