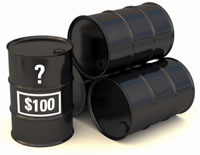
 After selling off nearly 14% the previous week, oil prices finished last week slightly higher at $99.65 per barrel. While the end result was a net positive, the volatility continued. Oil prices reached $104/barrel, and then fell to around $96, before nesting just below $100. As an investor, this volatility can be difficult to handle. Throw in the uncertainty of today's geopolitical environment, and investors feel the need to downsize their positions in commodity investments, such as oil.
We think markets could remain volatile in the short term, but following are three long-term indicators to support +$100 per barrel oil prices:
1.) Long-Term U.S. dollar weakness.
The U.S. dollar was up over 1% again last week and has increased nearly 4% since hitting a 52-week low on April 29. On a five-day rate of change, the dollar is up about 1 standard deviation.
As I said last week, this move is less about the vigor of the U.S. dollar and more about the relative weakness of the eurozone and other fledgling countries. In addition, it's likely we'll continue to see relative strength in the U.S. dollar as we get closer to the end of the Federal Reserve's QE2 program, which is set to wind down in June.
We think these are short-term drivers and don't accurately reflect the long-term headwinds facing the USD. I've discussed these often and in an attempt to keep this note brief, I'll let the following picture tell the story.
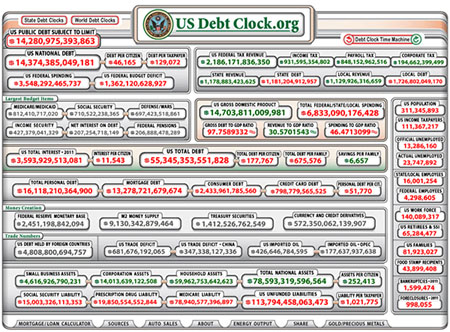
This snapshot from USdebtclock.org (taken late in the afternoon on May 13) shows the precarious fiscal and monetary situation of the U.S. As you can see, the overwhelming color is red. Even if Washington decided on a comprehensive plan to fix entitlement overspending, trim defense spending and reduce the U.S. deficit today, it would take years to see any meaningful shift in these figures.
Therefore, we feel the recent uptrend in the U.S. dollar is a short-term reprieve from a long-term downtrend:
2.) Demand from emerging markets outpacing developed market demand.
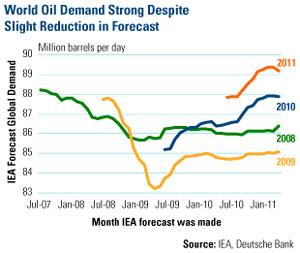 While developed world demand has struggled to retrieve its previous strength, emerging markets have captured a significant share of global demand over the past three years. Emerging market countries have narrowed the oil usage gap between developed and emerging markets from roughly 12 million barrels per day in 2007 to just 4 million barrels per day as of late 2010.
Last week, the Paris-based International Energy Agency (IEA) and the U.S. Department of Energy both communicated softness in global oil demand. The IEA noted that preliminary March data shows the first “marked slowdown” in annual growth for the first time since 2009. The IEA is forecasting growth of 1.3 million barrels per day in demand for crude oil in 2011, down from 2.8 million barrels per day in 2010.
This represents a significant slowdown in year-over-year growth and added to negative sentiment around oil last week, but it's important to put things into context. You can see from the chart that global oil demand grew at an incredible pace in 2010. The 1.3 million barrels of demand growth that is expected for 2011 is less than last year, but it's more along the lines of historical rates and maintains the forward momentum for rising oil demand.
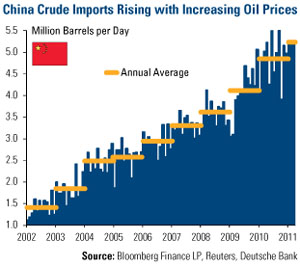 Emerging markets, driven by China, are the main source of the increase in demand. You can see from this next chart how China's demand for crude oil imports has grown over the past decade or so. China imported an average of just under 1.4 million barrels a day of oil in 2002 when prices were hovering around $20 per barrel.
In the years since, China's crude oil imports have increased more than 260% despite per barrel oil prices jumping nearly fourfold. This is indicative of the insatiable demand that emerging markets have for oil:
3.) Majority of Global Oil Reserves Located in Geopolitically Unstable Regions.
In the April 11 update Why High Oil Prices Are Likely Here to Stay, we highlighted how a large portion of the world's proven oil reserves and production comes from unstable countries and regions, including Nigeria, Venezuela, Iraq, Iran and Libya. According to some estimates, as much as 80% of the world's oil reserves lie beneath these shaky regions.
Civil wars and attacks on oil facilities can create production slowdowns or even shut down production entirely. The conflict in Libya and unrest in several other Middle East countries shows just how quickly this can affect global oil markets. Iraq is another example of the difficulties inherent in production expansion in these regions. Last week, the country's former oil minister said it would only be able to meet half of its stated production goal by 2017. The original forecast, clearly a lofty one, called for roughly 12 million barrels per day in oil production.
Over the years, the proximity of oil reserves to unrest has led to a reduction in global spare capacity or the excess amount of oil that can be produced, if desired, to meet demand. When the turmoil broke out in Libya, the general consensus was that Saudi Arabia's spare capacity would be more than enough to meet market demand. That hasn't been the case as Saudi Arabia has moved to calm its own population to prevent unrest.
The result is little wiggle room to meet demand should we experience a boom in demand or an event disrupting production. In general, these supply/demand dynamics support historically high prices.
All opinions expressed and data provided are subject to change without notice. Some of these opinions may not be appropriate to every investor. Standard deviation is a measure of the dispersion of a set of data from its mean. The more spread apart the data, the higher the deviation. Standard deviation is also known as historical volatility.
Frank Holmes
CEO and CIO
U.S. Global Investors


