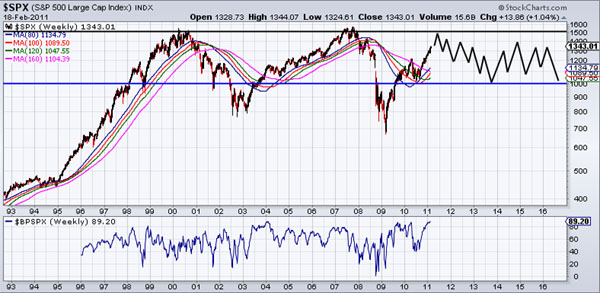
U.S. stocks are only following the same pattern they've followed in the last three bear markets. The midpoint crash (1907, 1937, 1974, 2008) gave way to a furious rebound in each case. Following 1937, the market retraced 62% of its losses. Following 1907 and 1974, the market peaked three and a half years later after retracing roughly 95% of the losses. Three and a half years and a 95% retracement equates to the S&P 500 peaking at 1500 in April of this year.
Before you assume I'm a permabear gold bug, take a look back to an article from February 2009. With the S&P 500 at 764, I called for a 15% decline before the market bottoms and rallies for months and significantly in percentage terms. In our 2011 Market Outlook we called for the market to peak in April or May possibly as high as 1500.
That forecast is on track as the market gains momentum while bearish forces quietly accumulate. We'll start with sentiment.
The following chart is the result of data from a BOA Merrill Lynch survey of asset managers and hedge funds who cumulatively manage nearly $1 Trillion. The data shows what percentage are overweight or underweight U.S. equities. The percentage of managers overweight U.S. equities has soared in recent months and is basically at a 10-year high.

The following charts are courtesy of the Short Side of Long (from AAII and Investors Intelligence data).

The 12 week-MA of the bullish sentiment is well north of peaks in the past five years.

The 12-week MA of Investors Intelligence bulls is at its highest level since January 2007. There is good chance it will surpass the 2007 level in the coming weeks. This growing bullish sentiment will coincide with the S&P 500 hitting major multi-year resistance. Excessive bullish sentiment coupled with multi-year resistance is not exactly a recipe for a major breakout. It's a recipe for the end to this cyclical bull market.
Moreover, as we've noted time and time again, the factors that will cause stocks to reverse are the same factors that will propel Precious Metals into the early stages of a bubble. Increased monetization will be required as interest rates begin to rise and as the economy fails to grow fast enough to mitigate the debt burden. New debts and the rollover of old debts will be financed at higher rates, thereby increasing the debt burden, which in turn, impacts the government's ability to juice the economy.
Higher rates won't be good for stocks and higher rates won't mitigate inflation or inflation expectations. The reason being, when you have a super high debt load (as most Western nations do) higher rates only exacerbate the debt burden. It will force local, state and the federal government to cut back, which has an impact on GDP. Higher inflation will also cut into corporate margins. We are expecting a mild bear market and not the 40%+ decline we've seen recently. We see a lack of interest in the gold market even though it is currently only 3% from its all-time high.
SentimenTrader, a great site that tracks sentiment for various markets said the following about gold:
"The pullback in gold has generated a ton of media attention, and that has impacted sentiment amongRydex traders, futures traders and the public in general, all of which are showing at least modestly extreme pessimism toward the metal. Overall, sentiment has become its least optimistic in gold in over two years."Further, a survey of wealth managers in Canada showed only 33% of advisers as bullish on gold. That figure was 64% as recently as Q410. This doesn't mean gold will immediately soar. More so, it tells us that gold's downside is limited, as sentiment has shifted significantly.
With stocks nearing major resistance carrying excessive bullish sentiment and gold's downside limited, let's take a look at the Gold/S&P 500 chart. The 2009-2010 price action has some similarities to the 20062007 price action. The chart shows that this is likely a good time to increase positions in gold and reduce positions in stocks.

After all the bubble bursts of the past decade, everyone wants to be a contrarian. If you are a regular Joe investor, now is your opportunity to be a contrarian and look smart in a few years. Mainstream managers now feel vindicated and see a chance to promote stocks again. Don't make the mistake many have already made twice. I'm writing this for both the mainstream and retirement investor because I don't want to see them get sucked back into the market at the wrong time courtesy of asset managers who'll find any reason to promote stocks.
Meanwhile, gold is providing an excellent opportunity. The hot money is out of gold, yet its only 3% off its highs. In the long run, that is scary bullish. In the coming months, look for stocks to peak and for gold to regain its leadership. If you'd like to learn more about how you can profit from the gold bull market then consider a free 14-day trial to our premium service.
Jordan Roy-Byrne, CMT
Jordan@TheDailyGold.com
Subscription Service