The basic fundamentals behind this inverse relationship are as follows: When U.S. monetary policy is looser, real rates fall; therefore, investors buy gold for a number of reasons. Firstly, lower real rates could imply higher inflationary expectations in the future, thus gold is bought as a hedge against this possible inflation. Secondly, lower real returns in Treasuries drive investors into risk assets in search of a higher return. This also sends gold, most commodities, risk currencies and equities higher. Thirdly, lower real returns on Treasuries reduce demand for U.S. dollars, causing the USD to fall and, consequently, the gold price rises in USDs. Finally, looser monetary policy imply the economic situation is not as rosy as many would like to believe; so, if the Federal Reserve acts by loosening monetary policy and driving down real interest rates, that sends a message that the economy is in a bad place and investors buy gold as a safe haven asset. There are likely many more reasons for this relationship, but we have just tried to cover the main ones.
While this inverse relationship is not perfect, it does have a distinct theoretical advantage over simply watching the USD/gold relationship because both U.S. dollars and gold can be in demand as safe haven assets at once. For example, if there were to be a crisis like the recent sovereign debt issues in Europe, money would flow into gold in search of a safe haven but also into dollars to escape the European issues. Investors would sell European bonds driving their yields higher and buy U.S. bonds driving their yields lower. Gold would be rising and the U.S. dollar would be rising, negating their typically negative correlation. However, U.S. rates would be falling as investors bought Treasuries as a safe haven and, therefore, the inverse relationship between gold and U.S. Treasury rates would hold firm.
The theoretical aspects of this may all be well and good, but what really matters to investors and traders like us is how these theories can be applied in the real world and how effective they are in producing profitable signals from which to trade. So, here is a practical example of how we applied and profited from this relationship in the real world. In late August 2010, we noticed that U.S. real rates were falling far more rapidly that gold prices were rising. We also held the view that the Fed was going to embark on another round of quantitative easing (QE) within the next three months; therefore, we did not see U.S. real rates rising, given the Fed would likely begin buying bonds heavily. From this, we inferred that gold prices we set to stage a major rally to a new all-time high and so signaled our subscribers to buy a great deal of out-of-the-money GLD call options to benefit from this rise (more details can be viewed in our full trading records, which is published on our website). We banked profits in percentage terms, 10x higher than the gains made by gold or the HUI Gold Mining Index during that period. And when the market began to price in QE2 and U.S. real rates fell, we bought again and enjoyed a similar return.
We are now of the opinion that U.S. real interest rates are still too low in relation to the current gold price. Therefore, we see the gold price going still higher to $1,500. Of course, this works both ways; so, if U.S. real rates begin rising there would likely be a serious correction in gold.
We are monitoring this situation closely and adjusting our position (and that recommended to our subscribers) accordingly, but the main purpose of this article is to draw investor's attention to this relationship and suggest that it form a pillar of their fundamental analysis with respect to gold. This is not to say other relationships, such as the USD and gold, are not to be notedthey should be, but in conjunction with U.S. real rates. By pulling all these relationships together, one can get a better picture of where the yellow metal is headed and when it's going to move, which, ultimately, leads to more profitable trading.
As mentioned before, we are of the opinion that gold prices are heading to $1,500. If you would like to take full advantage of this, please visit our website www.skoptionstrading.com to sign up to SK OptionTrader, our premium options trading service that costs just $99. We have closed 55 trades with 53 winners and an average gain of 45% per trade, including the two losing trades. Our model portfolio has an annualized return on investment of 84.35% without reinvestment of profits.
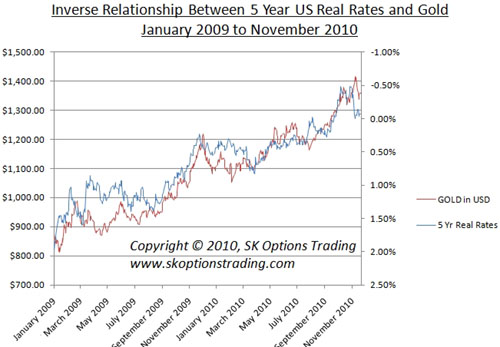
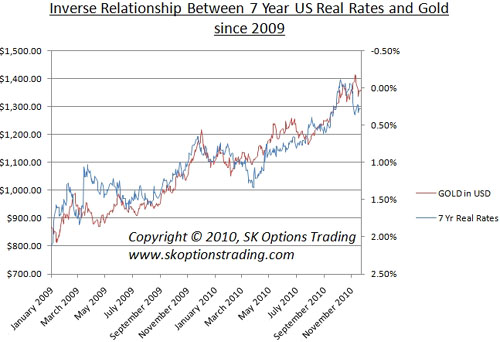
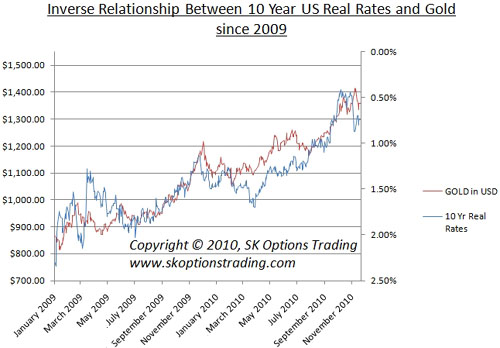
The charts in this article are plotted with the gold price in U.S. dollars on the left axis and inverted U.S. real interest rates on the right axis to illustrate the negative relationship between the two. The U.S. real rates data is taken from the U.S. Treasury Real Yield Curve and are commonly referred to as "Real Constant Maturity Treasury" rates, or R-CMTs. Real yields on Treasury Inflation-Protected Securities (TIPS) at "constant maturity" are interpolated by the U.S. Treasury from Treasury's daily real yield curve. These real market yields are calculated from composites of secondary market quotations obtained by the Federal Reserve Bank of New York. The real yield values are read from the real yield curve at fixed maturitiescurrently 5, 7, 10, 20 and 30 years. This method provides a real yield for a 10-year maturity, for example, even if no outstanding security has exactly 10 years remaining to maturity. Gold data is taken from the London Bullion Market Association.
Sam Kirtley
www.skoptionstrading.com