

Red Cat Holdings Inc.'s (RCAT:NASDAQ) chart continues to validate the original thesis.
What started as a base-and-breakout setup has now evolved into a sustained uptrend with higher highs, higher lows, and repeatable pullbacks that respect key Fibonacci support.
Importantly, all early targets have been met and exceeded, shifting the discussion from "does it work?" to "how far can this trend carry?"
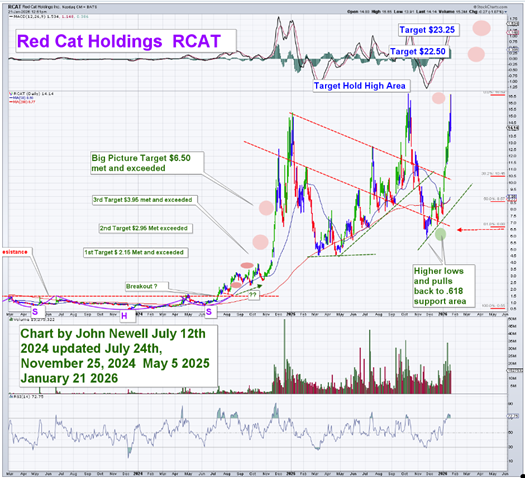
Looking back, the first target at US$2.15, followed by US$2.95 and US$3.95, were all achieved in sequence. The big picture target of US$6.50 was not only reached but exceeded decisively, confirming a structural change in the stock's behavior. That move marked the transition from accumulation to a momentum-driven advance, supported by expanding volume and improving liquidity.
Since breaking above US$6.50, RCAT has entered a more volatile but constructive phase. Price has been working through a rising channel, with pullbacks consistently finding support near the 0.618 Fibonacci retracement. This is classic trend behavior. Rather than collapsing after sharp advances, the stock has been digesting gains through time and controlled retracements, allowing moving averages to catch up.
The recent pullback into the US$8.00–US$8.50 area aligns closely with that 0.618 support zone and coincides with prior breakout congestion. From a technical standpoint, this is exactly where you want to see buyers step back in. The fact that price held this level and turned higher reinforces the idea that the trend remains intact.
Momentum indicators support this view. RSI has remained in a bullish range, resetting from overbought conditions without breaking down. Volume spikes continue to appear on up days, suggesting accumulation rather than distribution. This is not the behavior of a stock topping out, but one building energy for another leg higher.
From here, the next upside objectives are clearly defined. Initial resistance sits near US$22.50, followed by a higher target zone around US$23.25. These levels are derived from measured-move projections based on the prior consolidation range and the slope of the current advance. If momentum continues and broader market conditions remain supportive, these targets are achievable within the context of the existing trend.
The key technical takeaway is this: RCAT has transitioned from a breakout story into a trend-following name. Pullbacks toward support are no longer warning signs; they are opportunities for trend participants. As long as higher lows continue to form and the stock holds above its rising support structure, the path of least resistance remains higher.
For investors and traders who follow charts, Red Cat remains one of the cleaner technical setups in the drone and defense technology space right now. The stock has earned the right to be treated as more than a one-move wonder, and the chart continues to do the heavy lifting.
| Want to be the first to know about interesting Technology investment ideas? Sign up to receive the FREE Streetwise Reports' newsletter. | Subscribe |
Important Disclosures:
- As of the date of this article, officers, contractors, shareholders, and/or employees of Streetwise Reports LLC (including members of their household) own securities of Red Cat Holdings Inc.
- John Newell: I, or members of my immediate household or family, own securities of: None. My company has a financial relationship with: None. My company has purchased stocks mentioned in this article for my management clients: None. I determined which companies would be included in this article based on my research and understanding of the sector.
- Statements and opinions expressed are the opinions of the author and not of Streetwise Reports, Street Smart, or their officers. The author is wholly responsible for the accuracy of the statements. Streetwise Reports was not paid by the author to publish or syndicate this article. Streetwise Reports requires contributing authors to disclose any shareholdings in, or economic relationships with, companies that they write about. Any disclosures from the author can be found below. Streetwise Reports relies upon the authors to accurately provide this information and Streetwise Reports has no means of verifying its accuracy.
- This article does not constitute investment advice and is not a solicitation for any investment. Streetwise Reports does not render general or specific investment advice and the information on Streetwise Reports should not be considered a recommendation to buy or sell any security. Each reader is encouraged to consult with his or her personal financial adviser and perform their own comprehensive investment research. By opening this page, each reader accepts and agrees to Streetwise Reports' terms of use and full legal disclaimer. Streetwise Reports does not endorse or recommend the business, products, services or securities of any company.
For additional disclosures, please click here.
John Newell Disclaimer
As always it is important to note that investing in precious metals like silver carries risks, and market conditions can change violently with shock and awe tactics, that we have seen over the past 20 years. Before making any investment decisions, it's advisable consult with a financial advisor if needed. Also the practice of conducting thorough research and to consider your investment goals and risk tolerance.


