

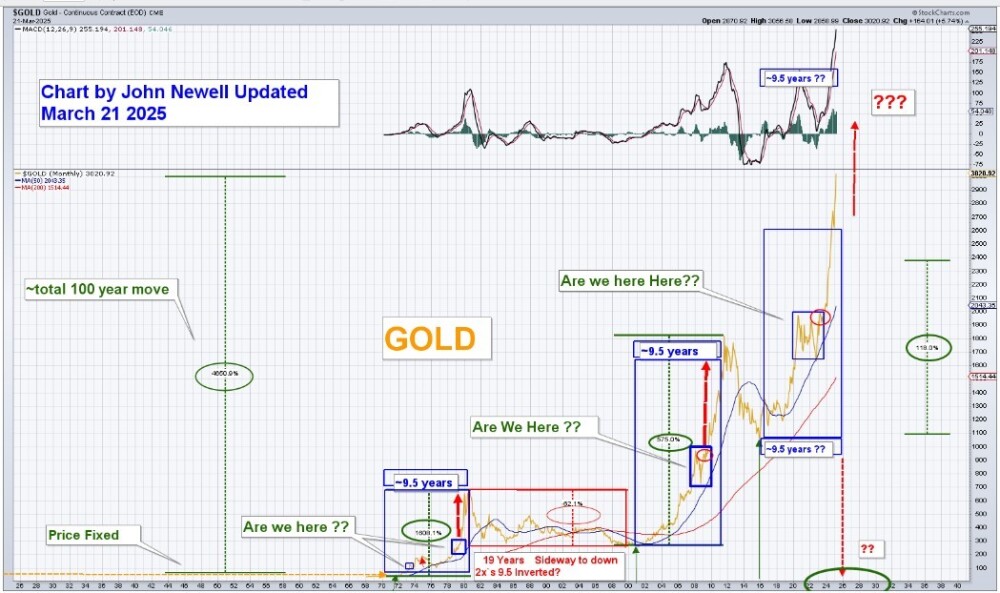
For the past 25 years, we have tracked the Dow/Gold ratio with obsessive precision. It's been my North Star through multiple economic cycles, helping me see through the noise and anticipate turning points in the markets. We maintain a chart that goes back a full century, and it's been flashing a signal I haven't seen in a generation.
We are now at a critical inflection point, perhaps the most important since the 1970s. Gold is breaking out to all-time highs. The U.S. dollar is weakening. Meanwhile, gold equities, especially juniors, are trading at some of the most attractive valuations in history. These dislocations rarely last, and when they resolve, they do so violently.
This time, the setup is even more dramatic than in previous cycles. What we're witnessing is the early stage of what may become the greatest wealth-building opportunity in 50 years.
We are witnessing a battle of historic proportions between two dominant forces: the Dow Jones Industrial Average and physical gold.
The outcome will determine where capital flows, and where fortunes are made, in the years ahead. This is the Battle of the Breakout.
Dow-to-Gold Ratio: A 100-Year Perspective
One of the most important charts to study right now is the Dow / Gold ratio. Historically, this ratio has served as a compass for capital allocation between paper assets and hard money. In 2000, it took 44 ounces of gold to buy a single Dow share. That number collapsed to just 6 ounces in 2011, during the last great gold bull. Today, it takes around 13 ounces. But what's more important than the level is the structure. The chart is forming a textbook pennant formation, tightening into a point of resolution. This kind of pattern doesn't drift sideways forever. It breaks. And when it breaks, it runs.
We've seen this play out before. In the 1970s, the Dow / Gold ratio fell 96%. In the 2000s, it fell 85%. Both collapses preceded enormous outperformance in gold and precious metals equities. Today's setup is no different, except it may be even more explosive, due to the extreme levels of global debt, monetary distortion, and geopolitical uncertainty.
In 1980, it took just one ounce of gold to buy one entire Dow share. In 2011, it was six. Could we return to those levels again? The pattern suggests we can, and we will.
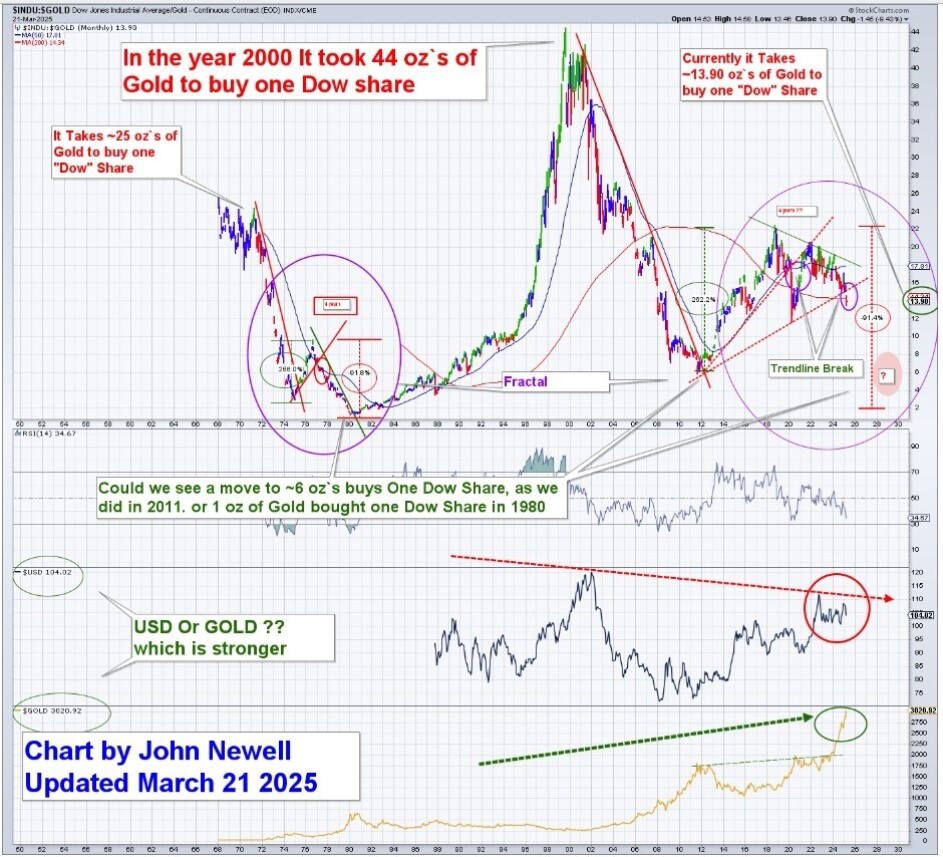
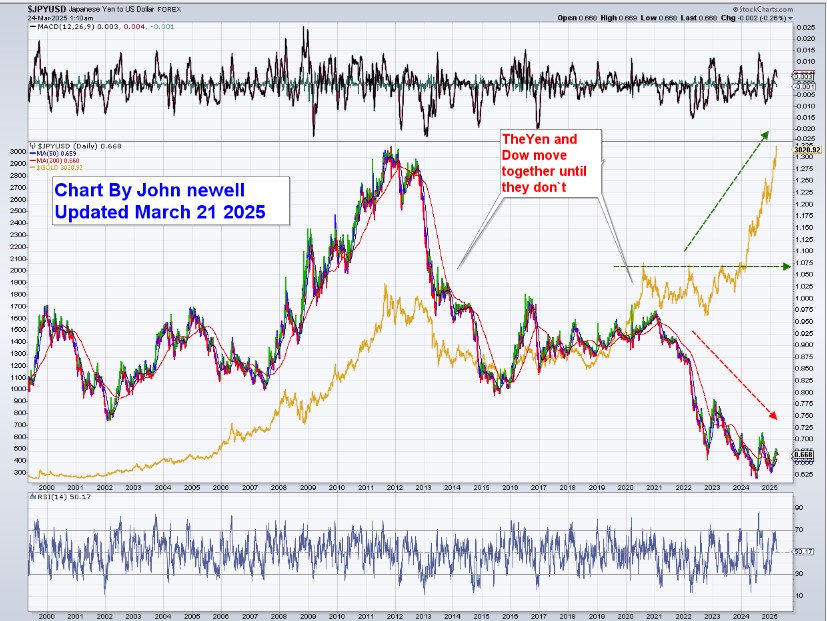
The chart above shows a powerful consolidation pattern, now on the verge of breaking. Just like the Japanese Yen (Chart below) and gold correlation in the 2010s, this will end, with a violent move in one direction.
The only question is: will it be gold or the Dow that wins?
Today it looks like Gold.
GDXJ-to-Gold Ratio: A Once-in-a-Lifetime Opportunity
Adding more evidence to this thesis is the GDXJ-to-Gold ratio, which shows just how badly gold equities have underperformed bullion.
Even as gold surges above $3,000 per ounce, junior mining stocks are priced as if gold were still trading at $1,200. This disconnect is historic. The last time we saw this kind of divergence was in the early 2000s, and what followed was a generational move in the miners.
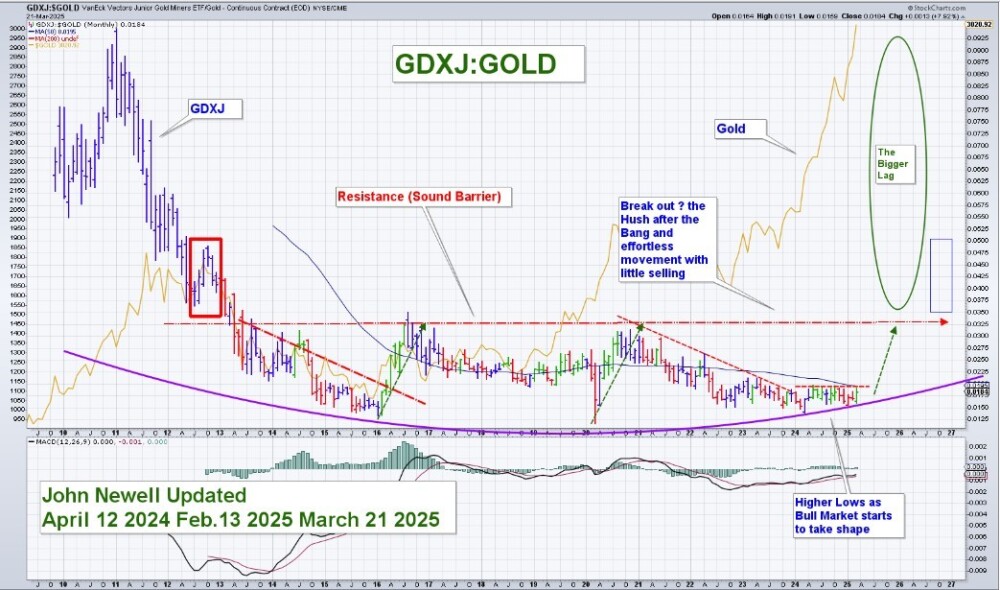
This is not just undervaluation. It's historic mispricing. While gold has broken into blue-sky territory, gold stocks are still stuck in the basement. The GDXJ / Gold ratio tells the story: shares are lagging so far behind bullion that the reversion trade could be explosive. We've seen this before, in 2002, in 2009, and we know how it ends.
When capital rotates, it rotates hard.
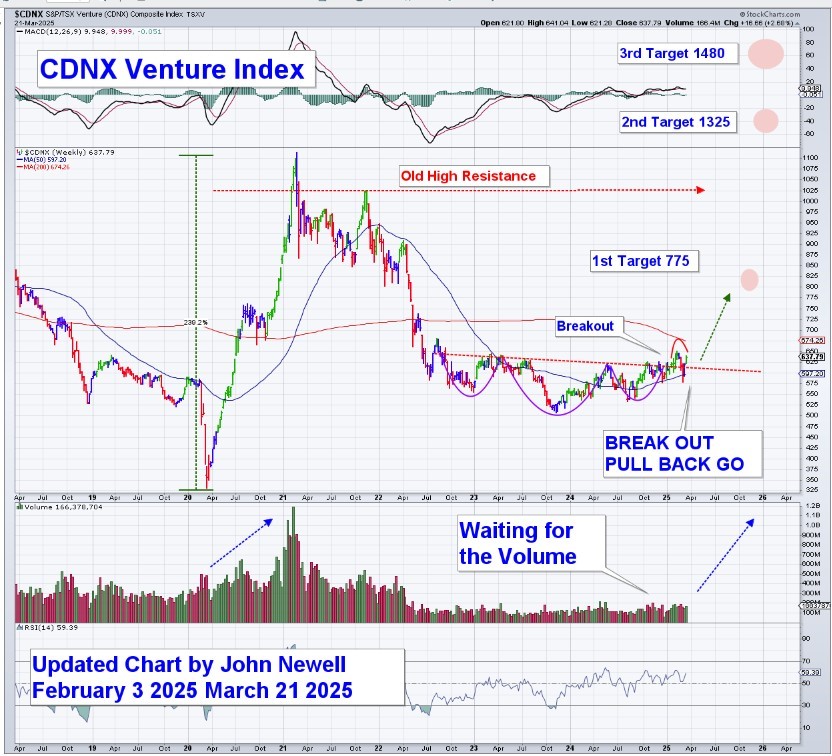
CDNX: The Junior Market Is Stirring
The CDNX Venture Index, a broad measure of Canadian junior mining companies, has just completed a textbook "Breakout, Pullback, Go" formation. After breaking out of a multi-year base, it successfully retested and is now bouncing off support. With upside targets at 775, 1325, and 1480, the technical setup is clear.
Volume is still building, but technically, the juniors are waking up. Smart money is already positioning quietly. If gold continues its upward trajectory, the junior market will not be far behind. When this sector moves, it doesn't just run; it explodes.
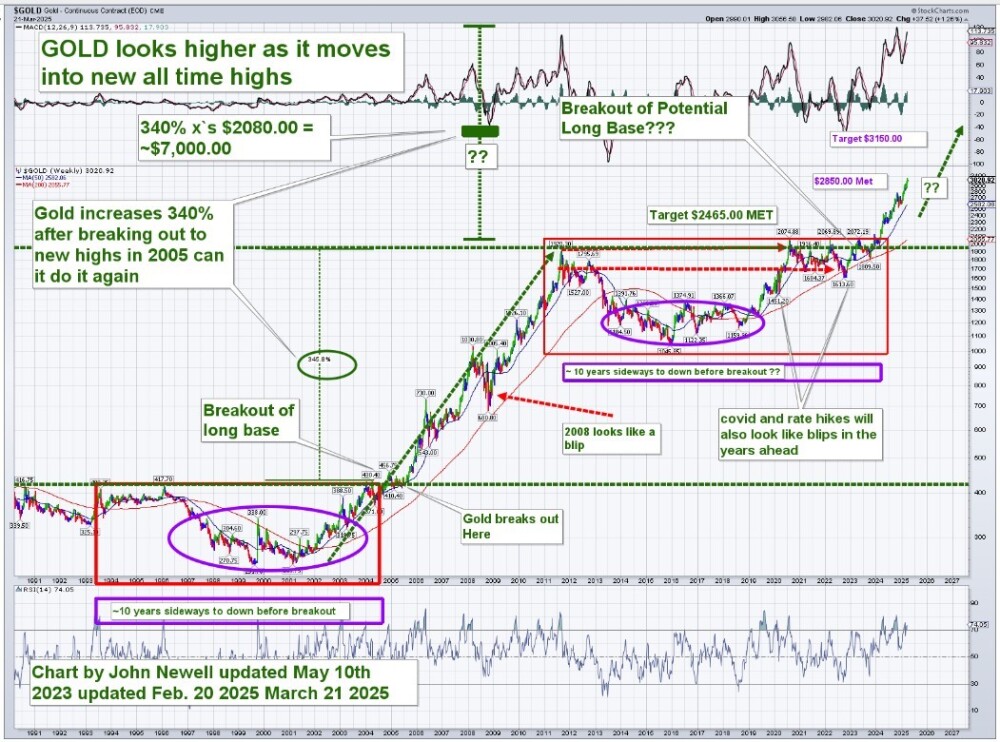
Gold Technical Picture: $7,000–$8,000 in Sight
The gold chart below points to much higher prices ahead.
The 2005 breakout delivered a 340% gain. If we apply that same percentage move from the recent breakout level of $2,080, we land near $7,000.
Another chart shows repeated 8x moves from major base formations.
Gold did this in the 1970s and again in the 2000s. A third 8x move from the 2015–2020 consolidation suggests a target near $8,000.
These aren't wild guesses. They're supported by technical patterns, macro pressures, and the same momentum cycles that have defined gold's behavior for the past century.
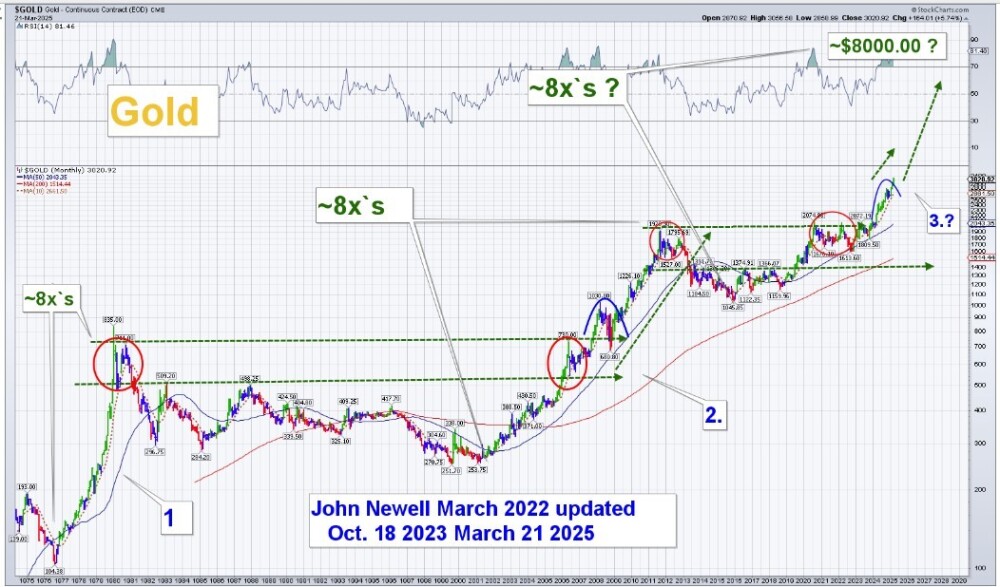
A century of price action is aligning to suggest that the next move in gold will be vertical. The long consolidation is ending. The charts don't lie.
Macro Fundamentals: Rocket Fuel for Gold
While the technicals provide the roadmap, the fundamentals are supplying the fuel.
First and foremost is the debt. The United States now holds a higher debt-to-GDP ratio than it did at the end of World War II. Unlike then, we haven't emerged from a global conflict; we've simply printed our way into a monetary dead end. Fiat currencies are losing credibility, and gold, true money, is rising to fill the void.
Real interest rates remain deeply negative. Even if inflation cools, rates are still below the cost of living. This is a textbook environment for gold strength. We're reliving the 1970s in high definition, and gold is the top performer in a stagflation environment.
Meanwhile, central banks around the world are accumulating gold at a record pace. China, Russia, and other sovereign entities are actively de-dollarizing. This is a structural, strategic shift away from U.S. hegemony, and gold is the beneficiary.
Mining supply remains constrained. The discovery rate of large gold deposits has collapsed. Grades are falling. Costs are rising. ESG delays and permitting challenges make new production harder to bring online. That sets the stage for sharply higher prices and surging valuations for exploration and development-stage companies.
USERX: A 50-Year Breakout is Underway
One of the most compelling charts in this setup is USERX, the U.S. Global Investors Gold & Precious Metals Fund.
It serves as a broad proxy for the entire precious metals sector. The fund is now breaking out of a 50-year consolidation pattern. The long-term downtrend line from the 1980s is broken. Price is coiling above rising support.
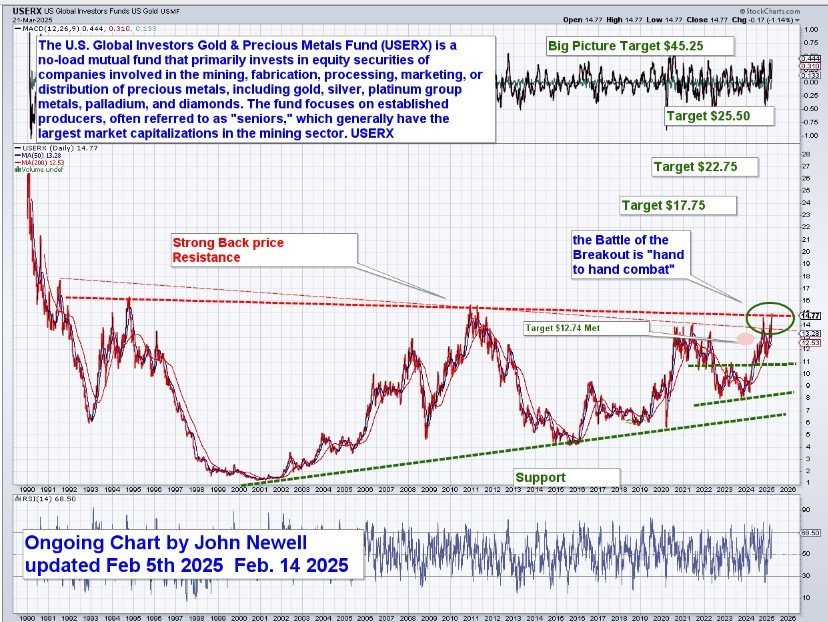
Resistance levels at $17.75, $22.75, and $25.50 are now within reach.
The longer-term target? $45 or more within the next five to seven years. This is not a typical breakout. This is the kind of structural move that redefines capital allocation for an entire generation of investors.
The Rifleman Approach: Targeted, Exponential Investing
USERX is a great proxy, but the real wealth will be made by those who take the Rifleman Approach: precise, selective, and high conviction investing. We're not talking about shotgun strategies. We're talking about sniper tactics.
Royalty companies, advanced explorers, and mid-tier producers with strong balance sheets, great assets, and tight share structures will deliver 5x to 10x returns and potentially more.
History proves this. In the 1970s and 2000s bull markets, the biggest winners were the disciplined stock pickers who bet early on the right names. We're entering a similar phase, one where a handful of great companies will generate generational wealth for those who act now.
HUI: The Third Major Move is Just Beginning (But Brace for Shock & Awe)
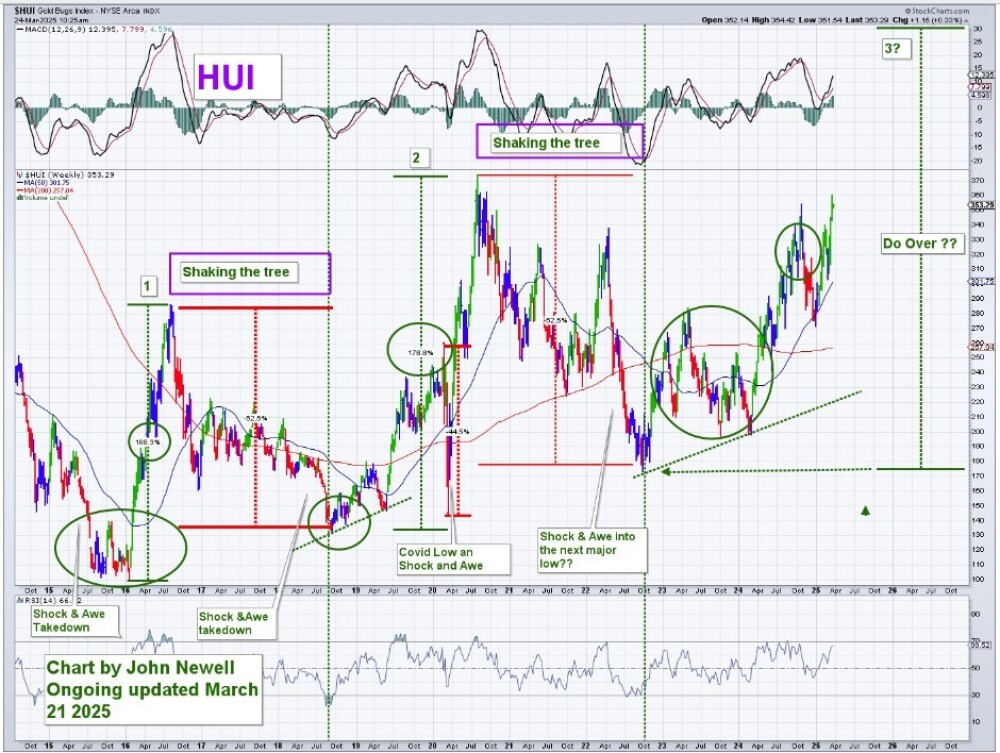
The HUI Gold Bugs Index has historically captured the explosive upside of precious metals equities during gold bull markets. Our updated chart shows two prior rallies, each around 180% in magnitude, that followed prolonged periods of base building and consolidation. Today, we appear to be in the early stages of what could become the third major leg higher in this cycle.
The current setup is strikingly like past moves, both in structure and timing. Rising momentum, a broad base breakout, and increasing relative strength are aligning again. If this pattern holds, and we believe it will, we could be on the verge of another 150–200% rally in precious metals shares over the next several years.
However, even in strong bull markets, corrections can be sharp, fast, and psychologically brutal. We call these "Shock and Awe" corrections sudden drawdowns that seem to come out of nowhere, often at the very moment the market looks its most bullish. They tend to occur around breakouts, new highs, or after extremely strong moves, when sentiment is most confident.
These corrections, often 20% or more, are part of the journey. They shake out the weak hands. But they are not signals to exit. They are signals to prepare, hold your conviction, and stay focused on the long-term trajectory.
This is still early. Gold equities continue to lag bullion by a wide margin. That gap will close, and when it does, it will do so with speed.
B2Gold: A Technical Setup with Compounding Fundamentals
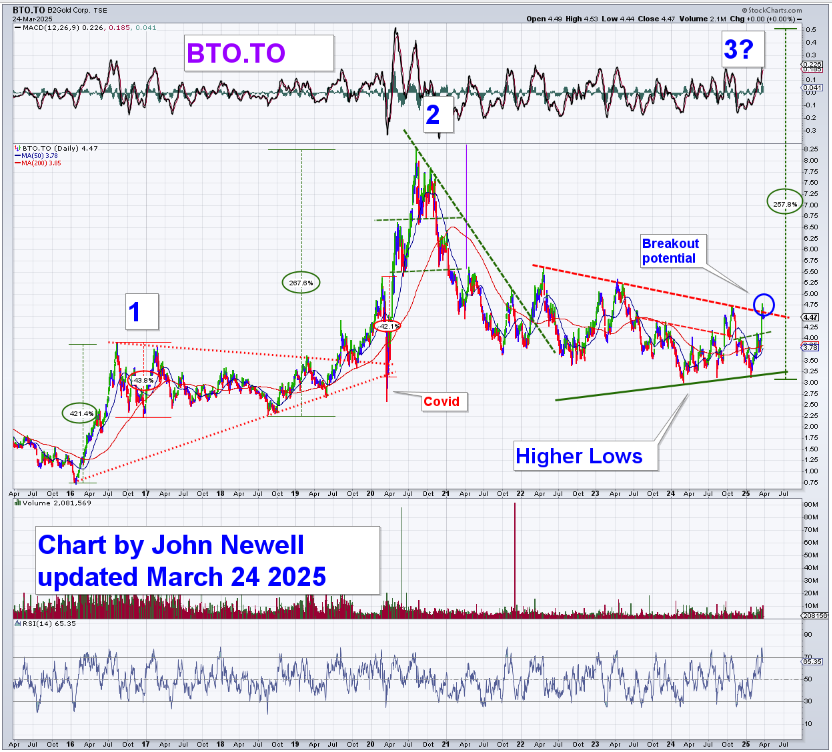
B2Gold Corp. (BTG:NYSE; BTO:TSX; B2G:NSX) is quietly setting up for what could be its third major advance since the gold bull market began in 2016. The chart shows a clear pattern:
- A 421% rally from the 2016 low.
- A second 267% move following the 2019 low.
- Now, in early 2025, B2Gold is forming higher lows and has just tested a breakout zone that could mark the beginning of the third major leg higher.
This setup aligns beautifully with the broader bullish trend in precious metals and the historical tendency for B2Gold to deliver outsized returns once momentum confirms. The technicals are clear: a series of higher lows, converging resistance, and rising RSI and volume suggest that B2Gold may be on the cusp of a powerful upside move.
But this is not just a chart story; it's a fundamentally driven breakout in the making.
B2Gold presents a unique investment opportunity for investors looking for growth exposure in the gold space, backed by strong leadership and financial discipline. The company has a proven management team, led by Clive Johnson, with a history dating back to Bema Gold, an exploration success story that began in the Yukon and expanded globally. That legacy continues today.
Strategically, B2Gold is making a bold move into Canada by acquiring Sabina Gold and Silver, as well as taking a stake in Snowline Gold, positioning itself in some of the most attractive and stable mining jurisdictions in the world. The Goose Mine in Nunavut is expected to be a transformational asset, potentially increasing overall production and reducing geopolitical risk.
Beyond expansion, B2Gold maintains some of the lowest production costs in the industry. Even after investing heavily in future growth, the company is expected to retain strong margins and robust cash flow generation, especially in a rising gold price environment.
B2Gold's balance sheet is another standout feature: essentially debt-free, with projected cash reserves exceeding $600 million, and one of the most attractive dividend yields in the gold sector. That combination of growth, financial strength, and shareholder returns is rare.
While exposure to Mali introduces some geopolitical risk, the company's diversification, with assets in Namibia, the Philippines, Colombia, and now Canada, primarily mitigates that.
In summary, B2Gold offers a compelling combination of technical upside, low-risk balance sheet strength, and smart jurisdictional moves. If the breakout in gold stocks continues to unfold, B2Gold could once again deliver a triple-digit return, just as it has in its past two major bull cycles.
Imperial Metals: Positioned for Copper's Bull Market
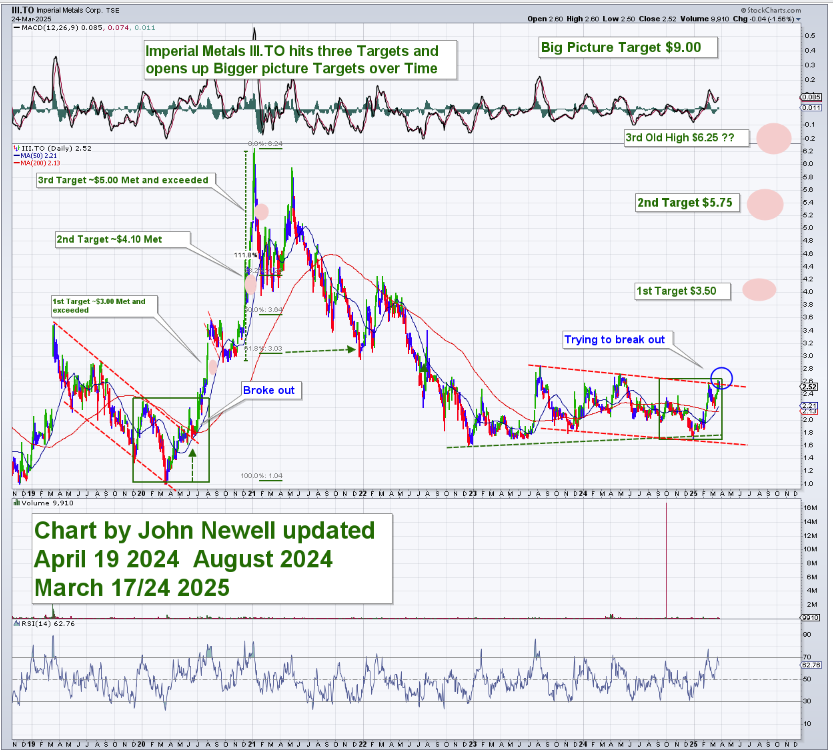
Imperial Metals Corp. (III:TSX; IPMLF:OTCMKTS)is another chart and company that deserves attention in this emerging commodity bull cycle. From a technical perspective, the chart shows a breakout in progress after a long base-building period. Imperial has already met and exceeded its first three technical targets in the past cycle ($3.00, $4.10, and $5.00), and it is now attempting to break out again with potential upside targets of $3.50, $5.75, $6.25, and even $9.00 over time.
This renewed strength aligns with a bullish copper outlook, and Imperial's positioning makes it one of the more compelling leveraged plays on a copper supply crunch.
Founded in 1959, Imperial Metals has evolved through multiple strategic phases, but its 2007 acquisition of the Red Chris copper-gold project in British Columbia marked a pivotal turning point. The company later sold a 70% stake in Red Chris to Newcrest Mining, retaining 30% and forming a long-term joint venture. With Newmont's acquisition of Newcrest in 2023, the project now benefits from the financial muscle and operational depth of a major producer, while Imperial retains meaningful upside through its 30% interest.
What makes this even more compelling is the macro backdrop for copper. As the world races toward electrification, through EVs, grid expansion, and renewable energy infrastructure, copper demand is projected to soar. Meanwhile, global supply remains constrained. Imperial controls a measured and indicated copper resource base of approximately 5 billion pounds, offering real leverage to rising copper prices.
Located in British Columbia, Imperial operates in a tier-one jurisdiction with supportive regulatory frameworks and strong relationships with Indigenous communities. This, combined with a tight share structure, offers investors a unique combination of jurisdictional safety, development potential, and high sensitivity to copper prices.
Financially, the company is backed by deep-pocketed shareholders, including N. Murray Edwards (45.02% ownership) and Fairholme Capital (11.86%). With a market cap of ~$410 million and a relatively small tradable float, share price moves can be dramatic when sentiment shifts, making this a high-beta copper play at a time when the market is just starting to re-rate copper equities.
In short, Imperial Metals is a bull market opportunity hiding in plain sight. With strong fundamentals, deep partnerships, and a technically bullish chart, the company stands to benefit significantly as copper becomes one of the most in-demand strategic metals of the next decade.
Conclusion: All Pedal, No Brake
This is not a moment of fear. It's a moment of opportunity. The breakout is real. The momentum is building. Capital is already rotating. And the precious metals sector is preparing to lead.
This is it. The charts are telling us. The fundamentals are aligning. The breakout is underway. All pedal. No brake.
But a word of caution is also in order. The very act of writing a bullish article like this one reflects a moment where prices have already begun to move, where confirmation is visible on the charts, and where optimism is increasingly justified. Ironically, these are often the moments when markets deliver their sharpest corrections. It's not a reason to doubt the long-term trend, but a reminder of how markets behave in real time.
Corrections, sometimes fast and unforgiving, are a natural part of the journey, especially in sectors like precious metals that are prone to emotional extremes. So be bold, but not reckless. Be aggressive, but precise. This is a moment for focused conviction, not blind enthusiasm.
This is the wealth cycle of our generation. Let's ride with eyes open and strategy in hand.
| Want to be the first to know about interesting Gold investment ideas? Sign up to receive the FREE Streetwise Reports' newsletter. | Subscribe |
Important Disclosures:
- John Newell: I determined which companies would be included in this article based on my research and understanding of the sector.
- Statements and opinions expressed are the opinions of the author and not of Streetwise Reports, Street Smart, or their officers. The author is wholly responsible for the accuracy of the statements. Streetwise Reports was not paid by the author to publish or syndicate this article. Streetwise Reports requires contributing authors to disclose any shareholdings in, or economic relationships with, companies that they write about. Any disclosures from the author can be found below. Streetwise Reports relies upon the authors to accurately provide this information and Streetwise Reports has no means of verifying its accuracy.
- This article does not constitute investment advice and is not a solicitation for any investment. Streetwise Reports does not render general or specific investment advice and the information on Streetwise Reports should not be considered a recommendation to buy or sell any security. Each reader is encouraged to consult with his or her personal financial adviser and perform their own comprehensive investment research. By opening this page, each reader accepts and agrees to Streetwise Reports' terms of use and full legal disclaimer. Streetwise Reports does not endorse or recommend the business, products, services or securities of any company.
For additional disclosures, please click here.
John Newell Disclaimer
As always it is important to note that investing in precious metals like silver carries risks, and market conditions can change violently with shock and awe tactics, that we have seen over the past 20 years. Before making any investment decisions, it's advisable consult with a financial advisor if needed. Also the practice of conducting thorough research and to consider your investment goals and risk tolerance.


