

This is the first oil market update in a very long time. A big reason for this is that, apart from a significant runup in 2022 that was followed by a drop of equal magnitude, oil has done little and is virtually unchanged from its price early in 2021. The reason for this update now is that it looks like the long stalemate is going to end soon with a big move that, barring a major war in the Middle East, is expected to be to the downside.
As many of you are surely aware, the world is tipping into the most serious economic depression in history, which is caused by the exponentially expanding debt that has now arrived at the point of total saturation, and all the continued issuance of debt will do is guarantee a hyperinflationary depression. While Trump is trying to rein it in, even with the best will in the world, you can't fix a problem that was decades in the making in the space of a month, six months, or even several years.
A hyperinflationary depression, or an economic implosion if debt issuance is choked off, means that the economy is contracting and people are getting poorer, which in turn means that there will be less demand for oil — much less. So, unless the powers that be decide they are going to attack Iran to please Israel and see what happens, the oil price looks set to break lower and crater, and the charts show that this could happen soon. This was all predicted many years ago by Elliott Wave theorist Robert Prechter in his youth as the end of an epochal "Grand Supercycle."
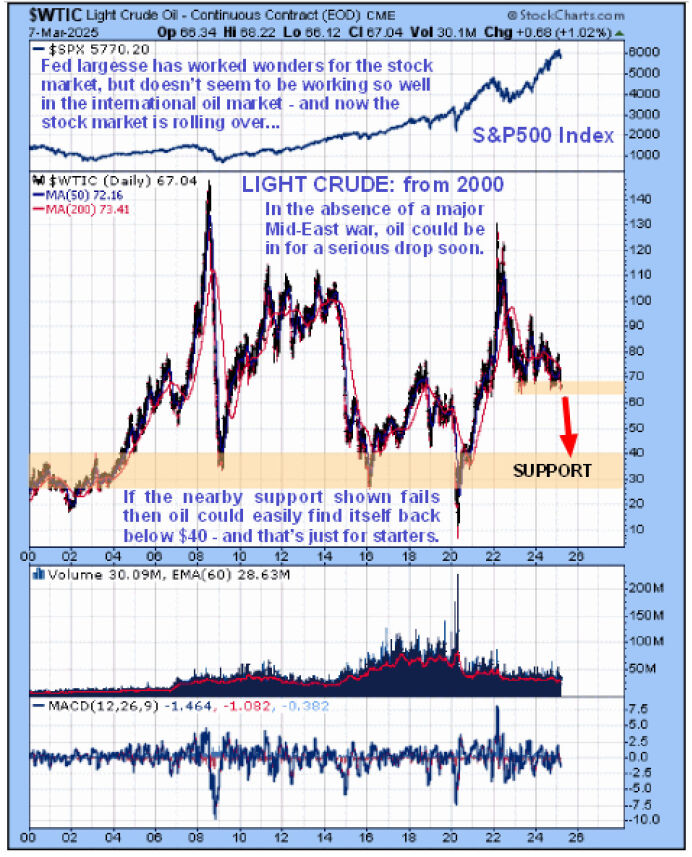
The Fed, of course, has done a sterling job of propping up the stock market up to now despite the rotten economy by creating money out of thin air in gargantuan quantities to throw at propping up the debt market, but it's gotten so extreme that they are "pushing on a piece of string" and as we have seen, the stock market has started to roll over and taking on a more definitely bearish appearance. Their largesse has not, however, extended to propping up the international oil market, and oil has been in retreat since mid-January to the point that it is threatening to crash a key support level, as we will now proceed to see on the charts.
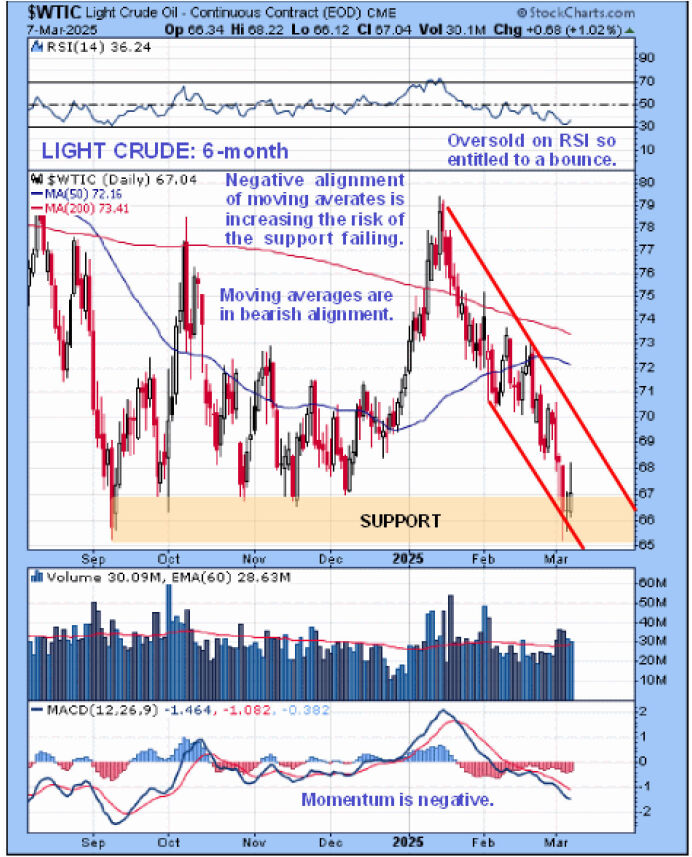
Whilst we cannot understand what is going on looking solely at a 6-month chart, it's a good point to start as it does show recent action in detail and how the price has been dropping quite steeply since the middle of January to arrive in a zone of important support towards and at the 6-month lows. It is short-term oversold at this support and so could bounce near-term, although the decidedly bearish alignment of its moving averages suggests a high probability that it will then turn lower again — if it bounces at all.
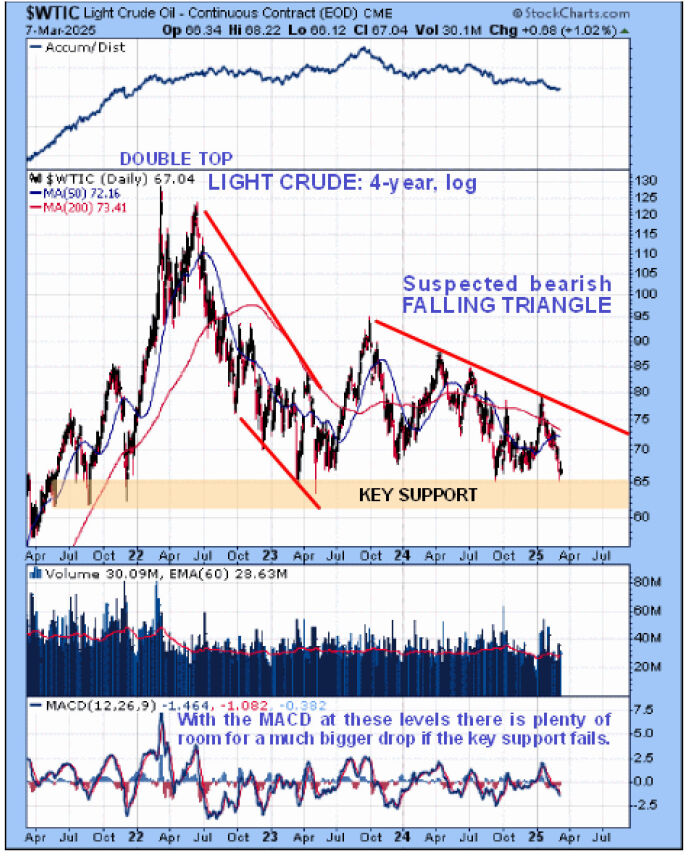
Zooming out via the 4-year log chart gives us a much broader perspective. On this chart we see that, apart from a sharp runup to the $128 area early in 2022, which gains were all lost by the end of that year, oil has been range bound for 4 years now from early 2021.
So what is this pattern that has formed from early 2021?
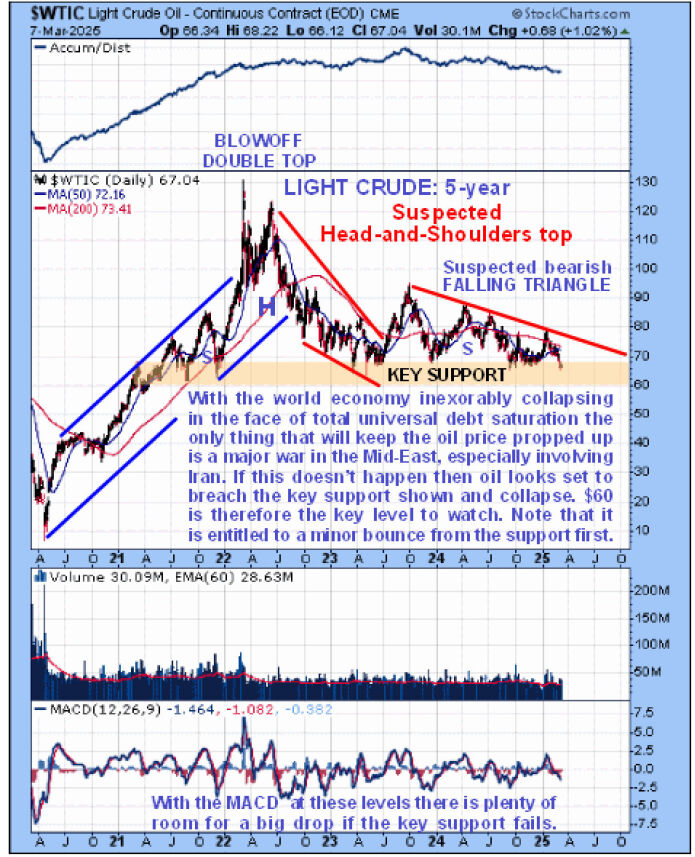
To figure that out, we will now proceed to look at the 5-year chart that shows us what preceded this pattern.
On the 5-year chart, we see that the pattern that has formed in recent years was preceded by a strong uptrend from the ridiculously low level in the Spring of 2020 associated with COVID-19.
On this chart, the pattern that has been forming since early 2021 looks like a giant irregular Head-and-Shoulders top, with its protracted Right Shoulder being a bearish Falling Triangle.
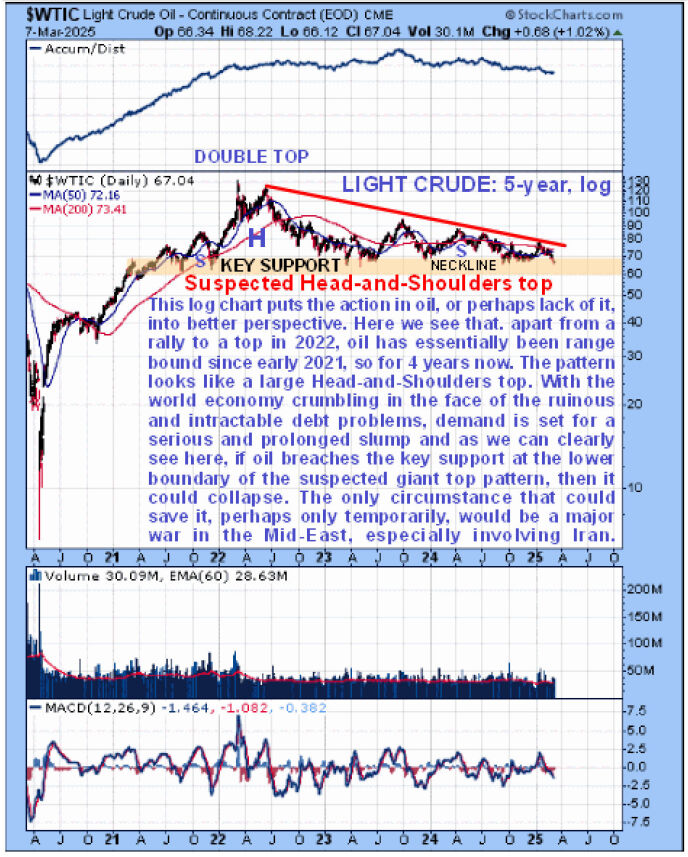
Switching to a 5-year log chart throws the potential top pattern of recent years into sharper relief.
This chart shows that the oil price has basically gone nowhere for four years and also makes even more clear the importance of the support level towards and at the $60 level.
If this support level is breached, it will be a huge psychological blow that can be expected to lead to a severe downtrend, and oil could crater, especially in percentage terms.
On the very long-term chart going back to the start of the millennium, i.e., to the start of the year 2000, we can see that should oil breach nearby support and drop, its first stop on the way down will be the support level in the $30 - $40 zone which would likely arrest the decline, although after consolidating in this area it could break to still lower levels.
Is there anything that could stop oil breaking down and instead get it moving higher?
Well, there is one thing, and that would be a major war in the Middle East involving Iran. Whilst there are powerful vested interests wanting to keep the oil price elevated, it seems a bit outlandish for them to go as far as orchestrating a war with Iran partly for this purpose, although it is perhaps not as far-fetched as many might think.
After all, we have many corrupt politicians in Europe wanting to put the continent on a war footing in part for the massive kickbacks that they would surely receive from the defense industry, although these could turn out to be small comfort if Europe ends up being nuked. Barring this scenario, however, oil looks like it is shaping up to drop and drop hard and perhaps soon.
| Want to be the first to know about interesting Oil & Gas - Exploration & Production investment ideas? Sign up to receive the FREE Streetwise Reports' newsletter. | Subscribe |
Important Disclosures:
-
Statements and opinions expressed are the opinions of the author and not of Streetwise Reports, Street Smart, or their officers. The author is wholly responsible for the accuracy of the statements. Streetwise Reports was not paid by the author to publish or syndicate this article. Streetwise Reports requires contributing authors to disclose any shareholdings in, or economic relationships with, companies that they write about. Any disclosures from the author can be found below. Streetwise Reports relies upon the authors to accurately provide this information and Streetwise Reports has no means of verifying its accuracy.
- This article does not constitute investment advice and is not a solicitation for any investment. Streetwise Reports does not render general or specific investment advice and the information on Streetwise Reports should not be considered a recommendation to buy or sell any security. Each reader is encouraged to consult with his or her personal financial adviser and perform their own comprehensive investment research. By opening this page, each reader accepts and agrees to Streetwise Reports' terms of use and full legal disclaimer. Streetwise Reports does not endorse or recommend the business, products, services or securities of any company.
For additional disclosures, please click here.
Clivemaund.com Disclosures
The above represents the opinion and analysis of Mr. Maund, based on data available to him, at the time of writing. Mr. Maund's opinions are his own, and are not a recommendation or an offer to buy or sell securities. As trading and investing in any financial markets may involve serious risk of loss, Mr. Maund recommends that you consult with a qualified investment advisor, one licensed by appropriate regulatory agencies in your legal jurisdiction, and do your own due diligence and research when making any kind of a transaction with financial ramifications. Although a qualified and experienced stock market analyst, Clive Maund is not a Registered Securities Advisor. Therefore Mr. Maund's opinions on the market and stocks cannot be construed as a recommendation or solicitation to buy and sell securities.


