

Armory Mining Corp. (ARMY:CSE; RMRYF:OTC; J2S:FRA), which changed its name from Spey Resources in November, is a junior exploration company focused on exploring minerals critical to the future of security and military applications, such as antimony, gold, silver and lithium and a variety of other minerals that will all be in increasing demand going forward with the prospect of seriously higher prices for most of them.
Small wonder then that the company's stock has been under accumulation for many months and is completing a large base pattern from which it is set to break out into a major bull market soon.
Before we look at the stock charts, which make a clear and robust case for buying Armory Mining, we will first overview the fundamentals of the company using slides lifted from the investor deck.
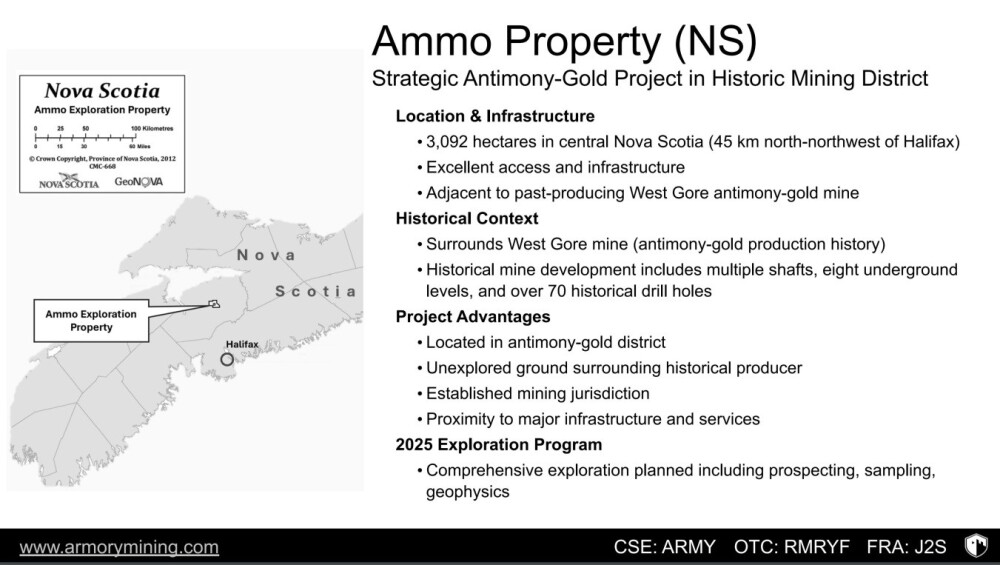
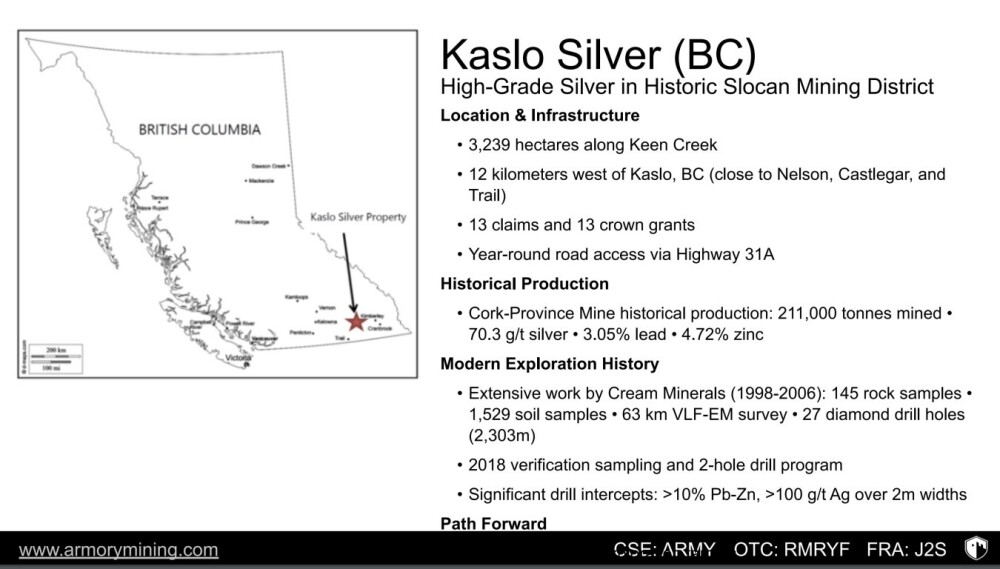
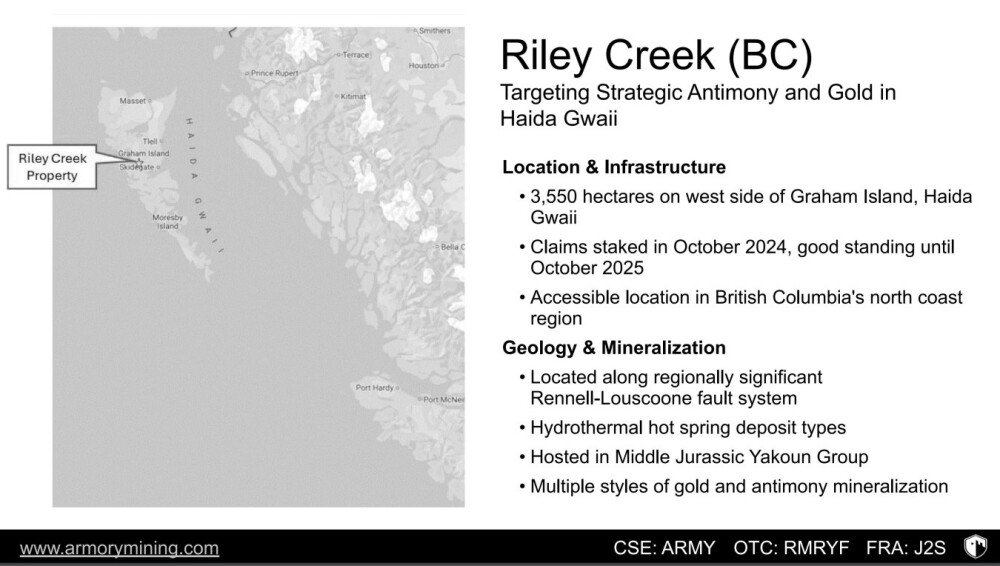
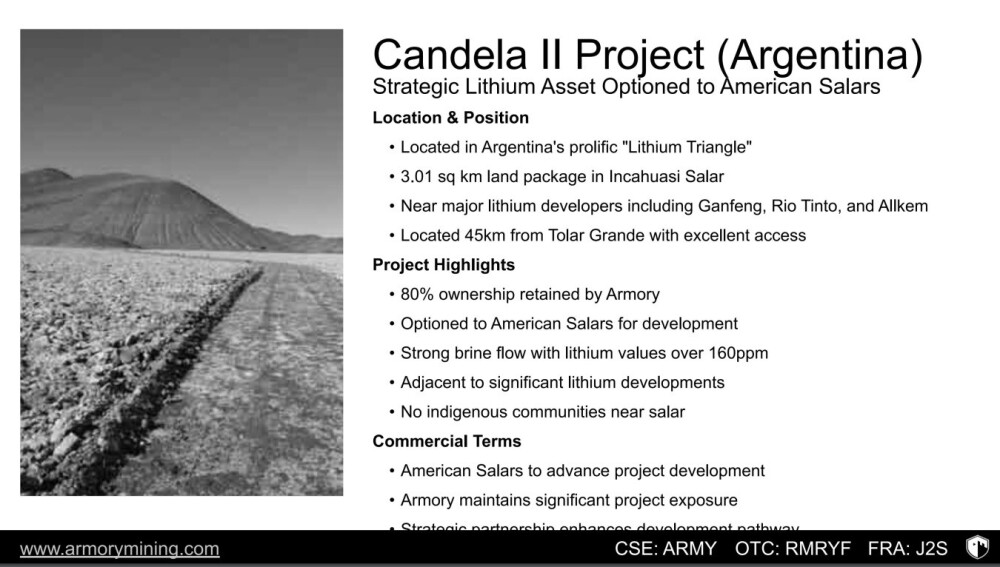
The company has four projects situated in proven mining regions with past producing mines where infrastructure is good, whose approximate locations are shown on the following slide. Three are in Canada, and one is in Argentina. The Ammo Property in Nova Scotia and the Riley Creek property in British Columbia are primarily antimony and gold projects, while the Kaslo Silver property in British Columbia is, as the name implies, primarily silver, and Candela II in Argentina is lithium.
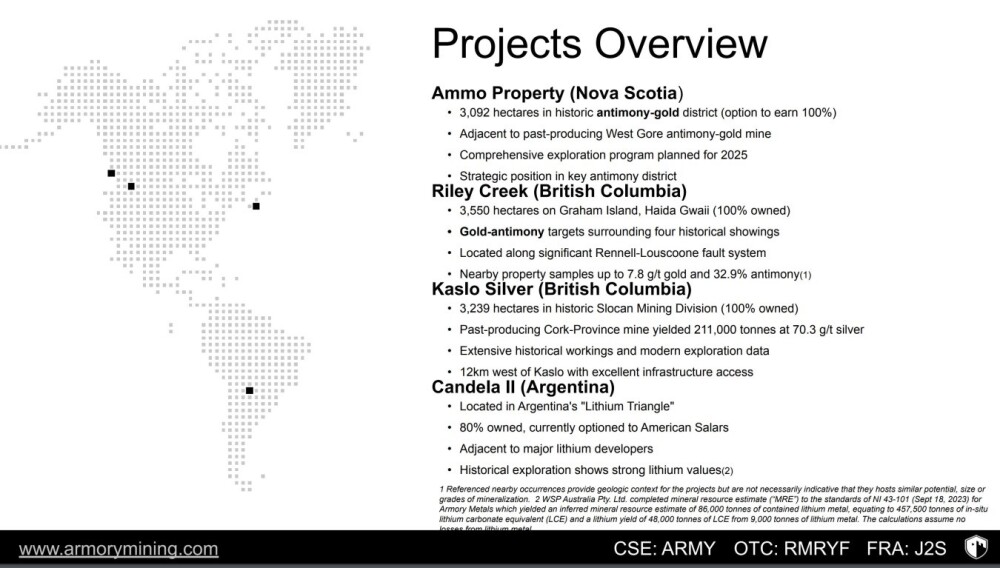
The following four slides provide a brief summary of each of the projects in turn.
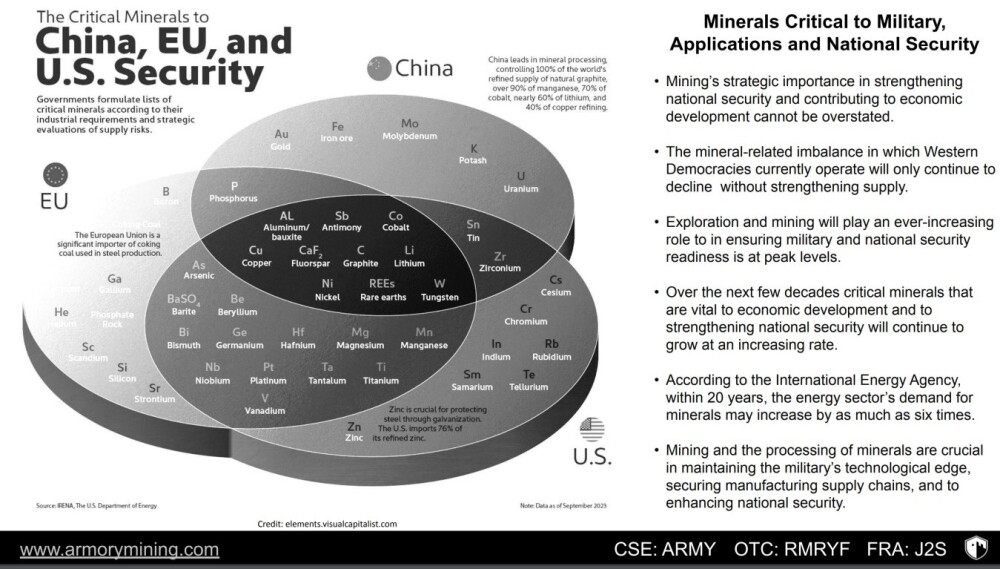
The following slide provides insights into the importance of different critical minerals to the major world trading blocs.
Below, you will see other highlights of the company.
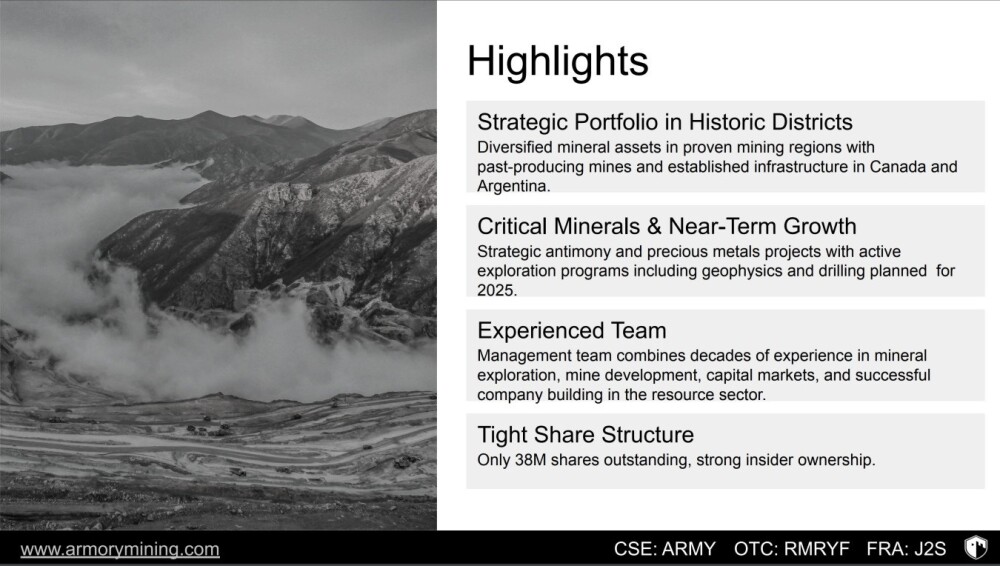
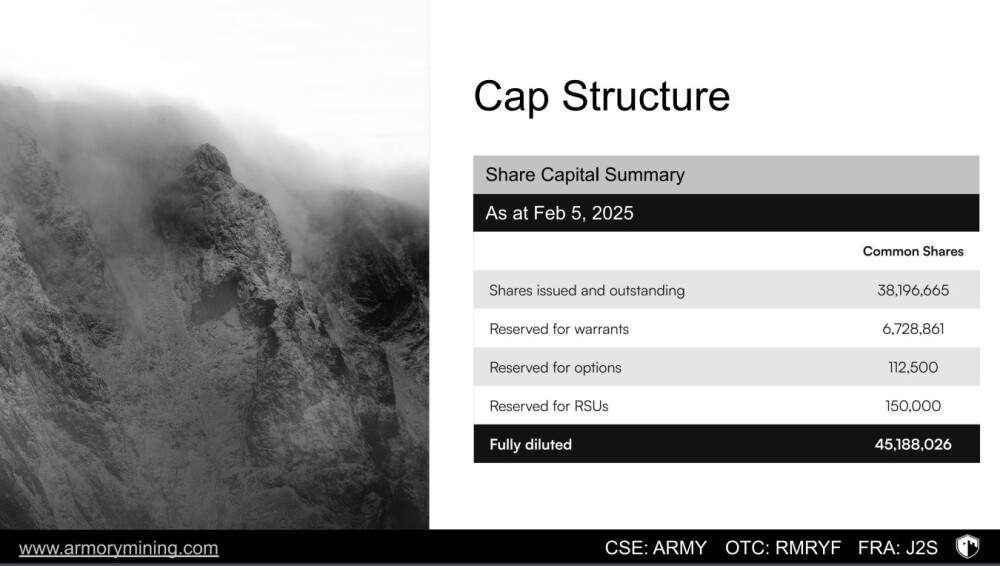
We see on the last slide that the company has a relatively modest 38.2 million shares in issue. The company currently has 11 million shares in the float.
The case for buying Armory Mining Corp. stock at this juncture is clear and powerful, as we will proceed to see when we look at its 18-month chart lower down the page, but first, we will see how we got here by reviewing the long-term chart.
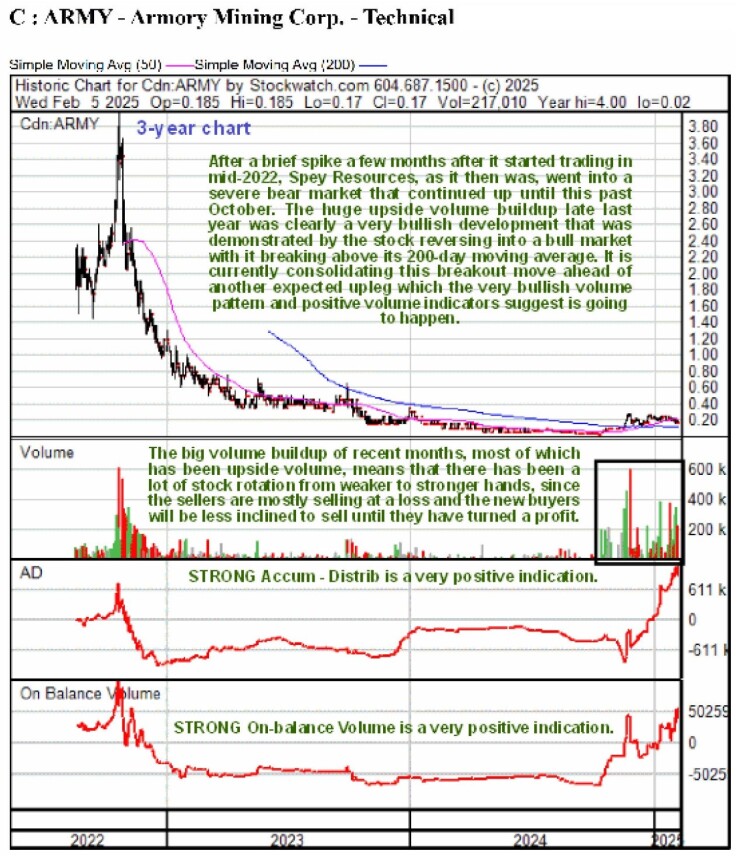
The 3-year chart for Armory Mining shows the stock from its inception in the middle of 2022. At that time, it was known as Spey Resources, and it only changed its name as recently as this past November. As we can see, after it came to market, it consolidated for a few months before running up in a short-lived spike that took it briefly as high as about CA$4.00.
Following this peak, it went into the severest of bear markets that, by the time it had finally run its course last October, had rendered the stock almost worthless. However, before it hit bottom, it had started a basing process as far back as last April, which we will now look at in much more detail on an 18-month chart.
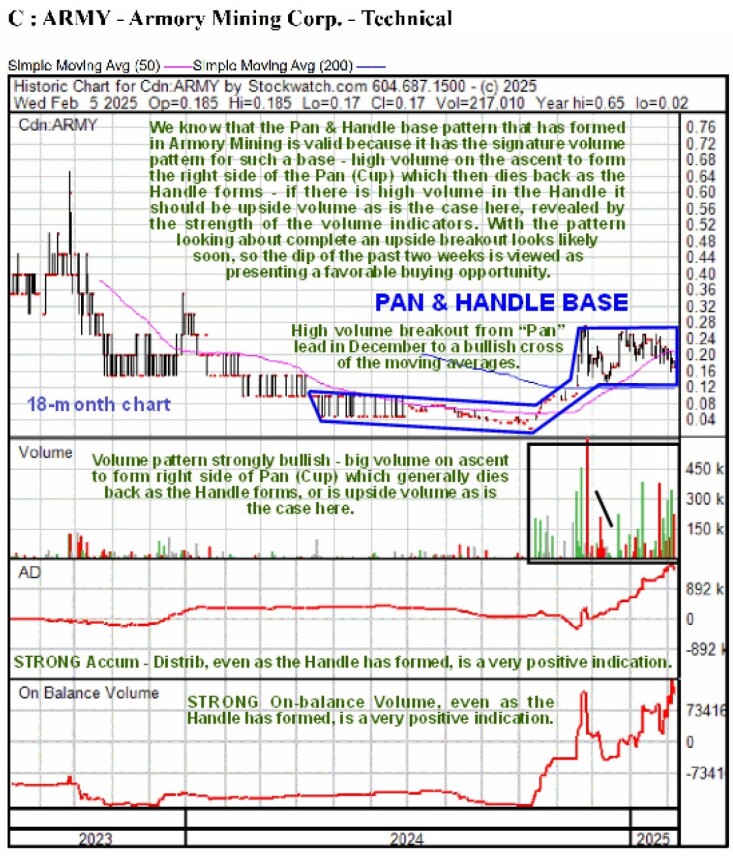
On an 18-month chart, we can see that a low tilted Pan & Handle base started to form as far back as last April, even though the stock went on to make new lows later in the year. It is only because of the price / volume action in the latter part of this base pattern that we can be reasonably sure that this is what it is, for a giveaway characteristic of a valid Cup & Handle or Pan & Handle base is the heavy volume that appears as the price rallies to form the right side of the Cup or Pan and there is a fundamental explanation for this.
It is caused by "Smart Money" / insiders realizing that the company has "turned the corner" and is headed for better times. However, the enthusiasm usually gets overdone short-term with a sharp runup followed by a "cooling off" period, which is when the Handle of the pattern forms as it takes time for the fundamentals to catch up with the anticipated improvement that has already been discounted by the market.
Normally, during the early part of the buildout of the Handle, volume drops back, and it has in this case, but then it built up again over the past month or so, which is not negative because most of this volume has been upside volume, which is why both the volume indicators shown have continued to advance even as the price has tracked sideways. This is very positive and portends an upside breakout soon into a major bull market.
On the 6-month chart, we can see recent action in much more detail and how the trading range that has formed from mid-November that comprises the Handle of the Pan & Handle and how the mild downtrend of the past few weeks has brought the stock down to a favorable entry point towards the lower boundary of the range.
The positive volume pattern and strong volume indicators suggest a favorable outcome, and breakout from the entire base pattern will be signified by a break above the resistance shown at the top of this range.
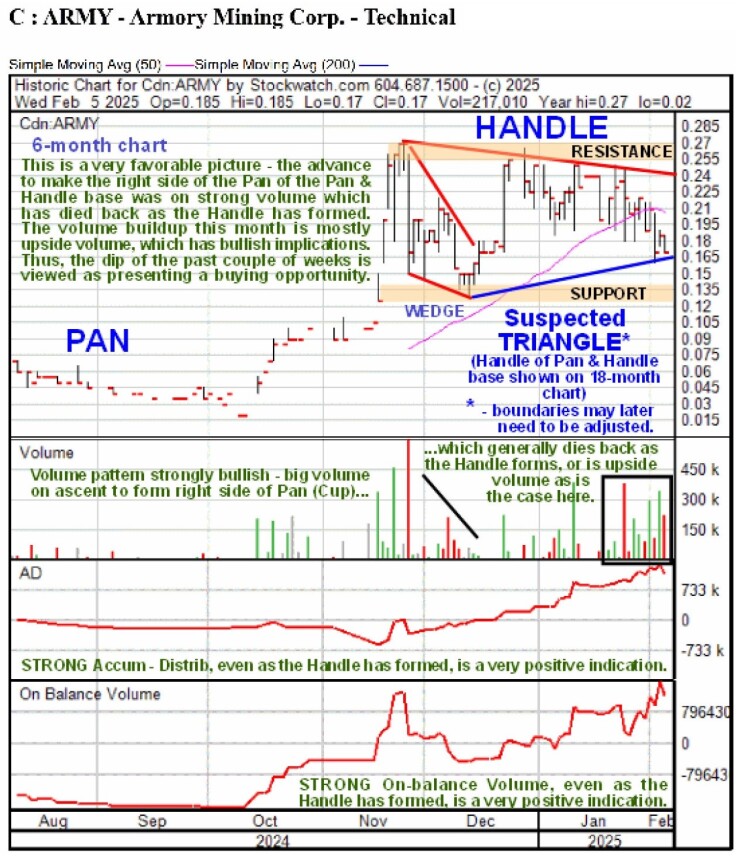
The conclusion is that this is an excellent entry point for Armory Mining, which is rated as an Immediate Strong Buy for all time horizons.
Armory Mining Corp.'s website.
Armory Mining Corp. (ARMY:CSE; RMRYF:OTC; J2S:FRA) closed for trading at CA$0.16, US$0.12 on February 6, 2025.
| Want to be the first to know about interesting Gold, Silver, Cobalt / Lithium / Manganese and Critical Metals investment ideas? Sign up to receive the FREE Streetwise Reports' newsletter. | Subscribe |
Important Disclosures:
- For this article, the Company has paid Street Smart, an affiliate of Streetwise Reports, US$3,000.
- As of the date of this article, officers and/or employees of Streetwise Reports LLC (including members of their household) own securities of Armory Mining Corp.
- Author Certification and Compensation: [Clive Maund of clivemaund.com] was retained and compensated as an independent contractor by Street Smart to write this article. Mr. Maund is a technical analyst who analyzes historical trading data and he received his UK Technical Analysts’ Diploma in 1989. The recommendations and opinions expressed in this content reflect the personal, independent, and objective views of the author regarding any and all of the companies discussed. No part of the compensation received by the author was, is, or will be directly or indirectly tied to the specific recommendations or views expressed.
- Statements and opinions expressed are the opinions of the author and not of Streetwise Reports, Street Smart, or their officers. The author is wholly responsible for the accuracy of the statements. Streetwise Reports requires contributing authors to disclose any shareholdings in, or economic relationships with, companies that they write about. Any disclosures from the author can be found below. Streetwise Reports relies upon the authors to accurately provide this information and Streetwise Reports has no means of verifying its accuracy.
- This article does not constitute investment advice and is not a solicitation for any investment. Streetwise Reports does not render general or specific investment advice and the information on Streetwise Reports should not be considered a recommendation to buy or sell any security. Each reader is encouraged to consult with his or her personal financial adviser and perform their own comprehensive investment research. By opening this page, each reader accepts and agrees to Streetwise Reports' terms of use and full legal disclaimer. Streetwise Reports does not endorse or recommend the business, products, services, or securities of any company.
For additional disclosures, please click here.
Clivemaund.com Disclosures
The above represents the opinion and analysis of Mr. Maund, based on data available to him, at the time of writing. Mr. Maund's opinions are his own, and are not a recommendation or an offer to buy or sell securities. As trading and investing in any financial markets may involve serious risk of loss, Mr. Maund recommends that you consult with a qualified investment advisor, one licensed by appropriate regulatory agencies in your legal jurisdiction, and do your own due diligence and research when making any kind of a transaction with financial ramifications. Although a qualified and experienced stock market analyst, Clive Maund is not a Registered Securities Advisor. Therefore Mr. Maund's opinions on the market and stocks cannot be construed as a recommendation or solicitation to buy and sell securities.


