West Point Gold Corporation (WPG:TSX; WPGCF:OTCQB) is the product of the amalgamation of two gold exploration companies, Bullett Exploration and Gold79 Mines Ltd, which also involved the absorption of Gold79's wholly owned subsidiary, 1492834 B.C. Ltd. (Subco).
This amalgamation was announced successfully completed on November 26, in furtherance of which the company started trading under the new name West Point Gold and with the stock symbol WPG on December 23 last year, with the OTC market symbol changing to WPGCF.
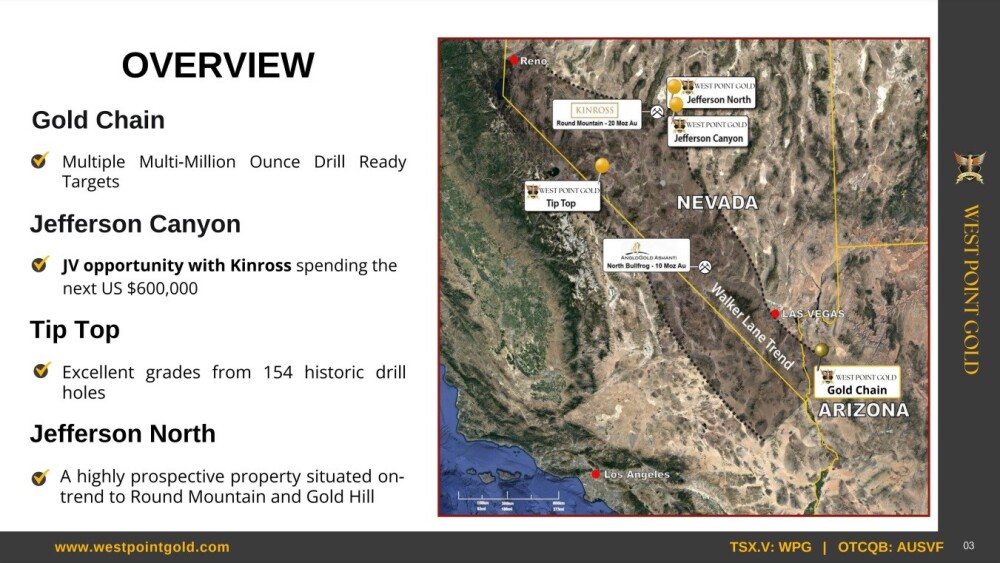
The combined company's assets comprise four gold discovery and development projects located along the prolific Walker Lane Trend spanning Arizona and Nevada in the southwestern U.S., where the focus is on building ounces by developing a maiden resource at its Gold Chain Project in Arizona while joint venture partner Kinross is advancing the Jefferson Canyon project in Nevada.
This illustration overviews West Point Gold following the merger and shows the locations of the four principal assets in Nevada and over the border in Arizona:
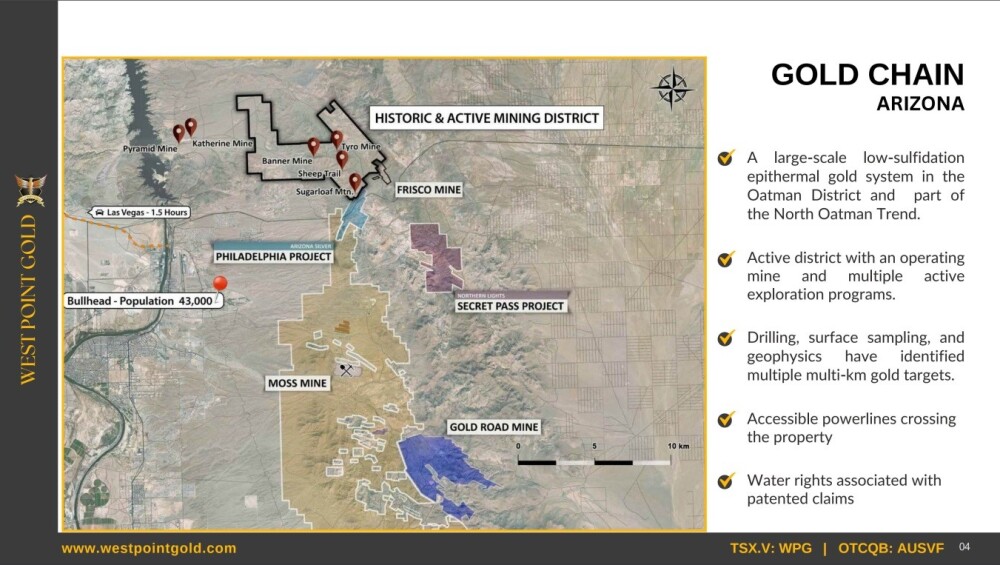
This next picture shows the geographical extent and location of the Gold Chain Project in Arizona and its proximity to other exploration projects and an operating mine on the North Oatman Trend augurs well for significant discoveries on the property.
A very important point worth making here is that at the end of last year, the news came out that Mako Mining announced its intent to acquire the Moss Mine in Arizona, expanding its operations in the Americas.
As we can see on the map above, the Moss Mine property is very close to West Point's Gold Chain property, so this development has two important implications for West Point.
One is that Mako's interest in the Moss Mine signifies that there is a worthwhile resource there, otherwise Mako would not interested in buying it, which means that there are probably significant resources on the Gold Chain property, as it is nearby on the same trend.
The other is that it increases the likelihood that a larger resource company will approach West Point in the future wanting to buy the Gold Chain property or even West Point itself, which will have obvious major benefits for West Point shareholders.
Impressive grades have already been discovered at Gold Chain.
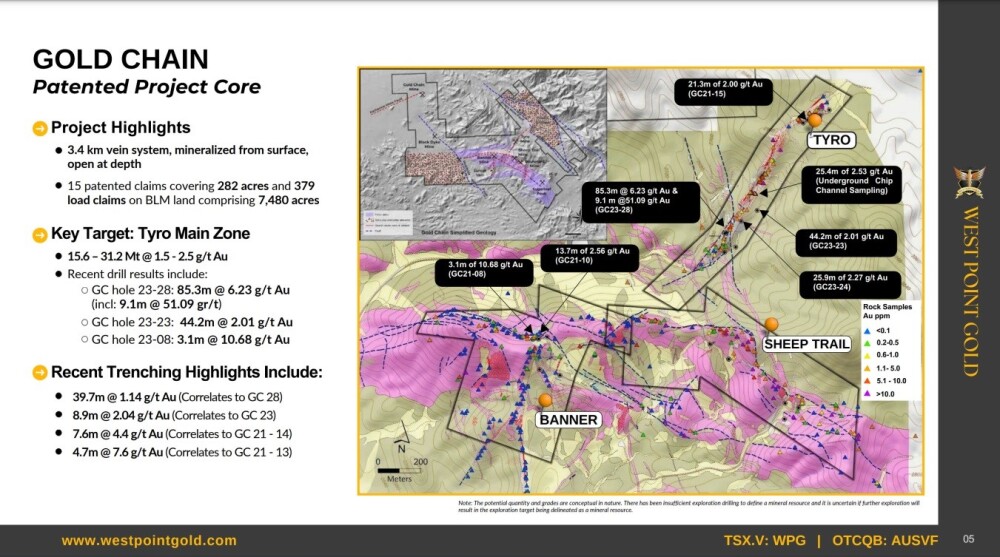
Please refer to the company's investor deck for more information on the geology of Gold Chain and its other properties.
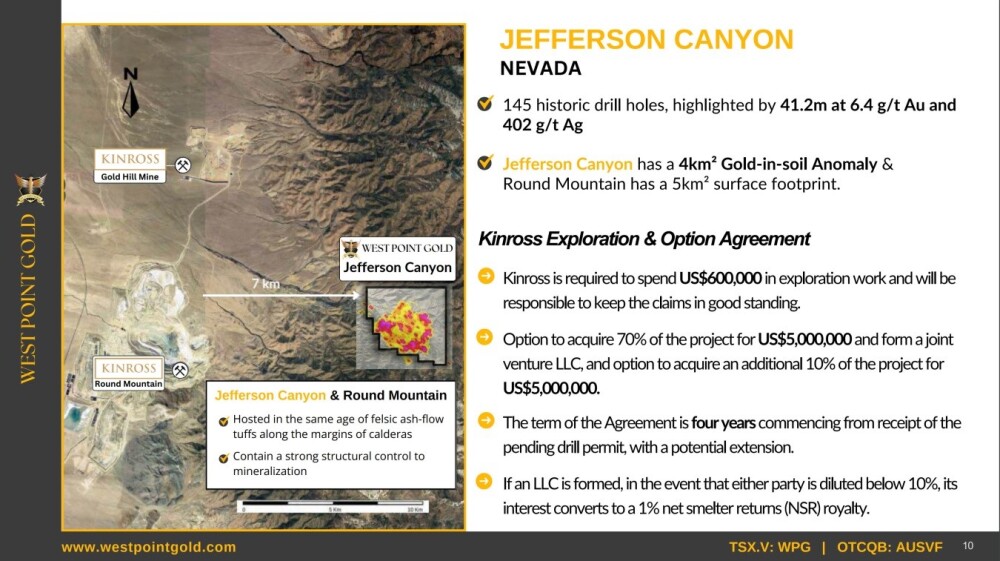
Meanwhile, joint venture partner Kinross Gold Corp. (K:TSX; KGC:NYSE) is advancing the company's Jefferson Canyon project in Nevada.
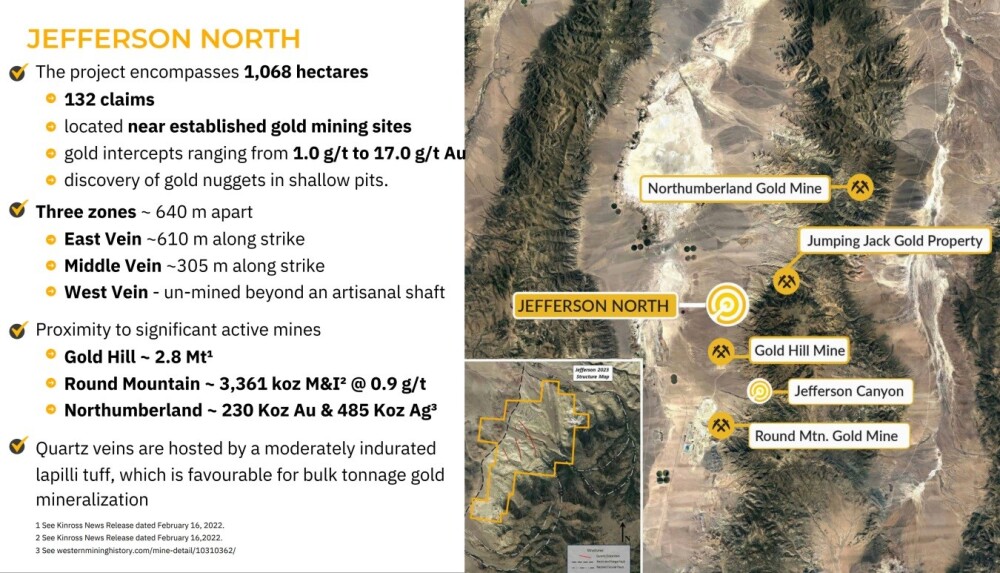
This slide provides an overview of the Jefferson North property in central Nevada, which is not far north of the Jefferson Canyon Project:
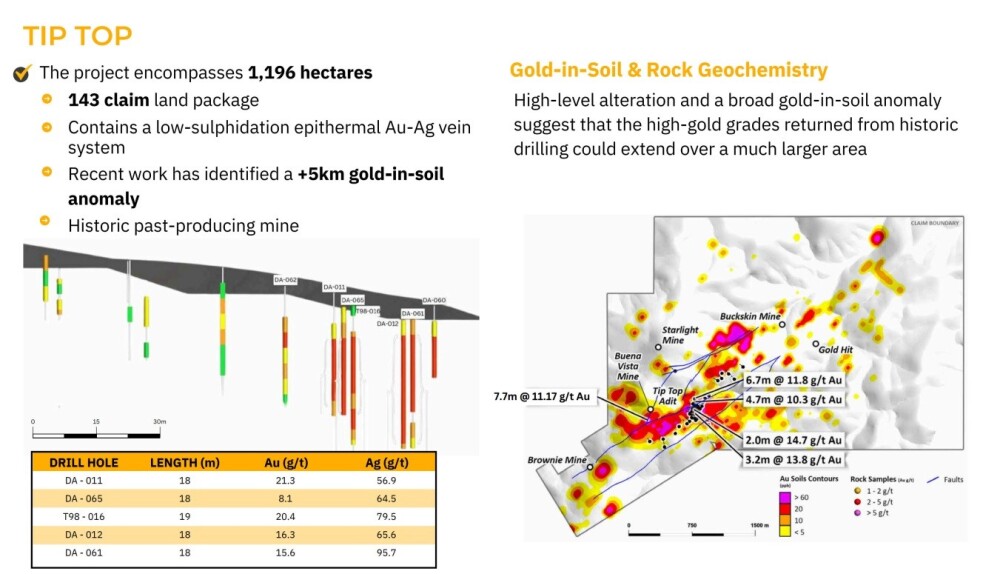
To the southwest, impressive grades have been discovered at the 1196 Hectare Tip Top property.
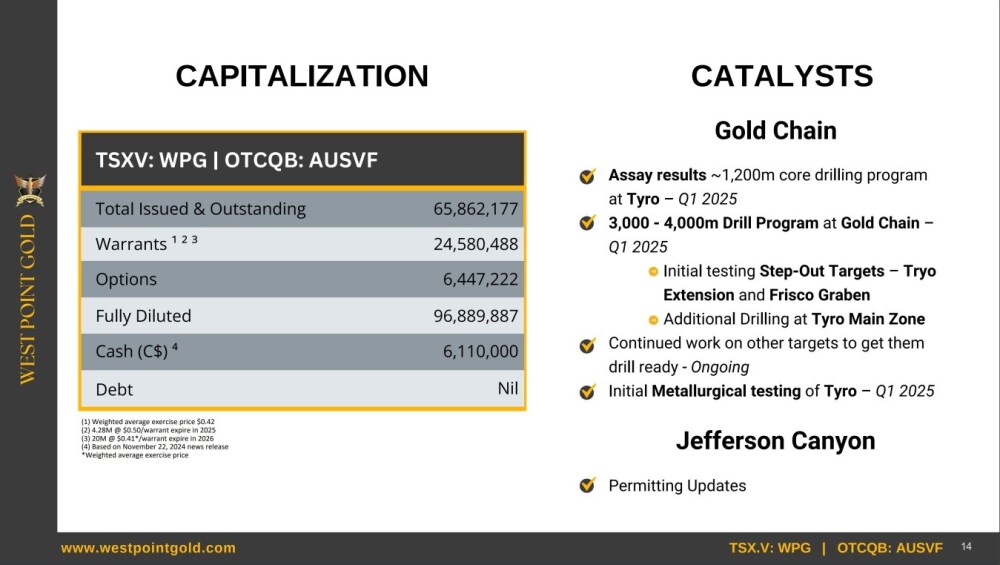
The number of shares in issue in the combined company is 65.8 million, with the management and board, institutions, and Kinross owning a sizeable quantity of them.
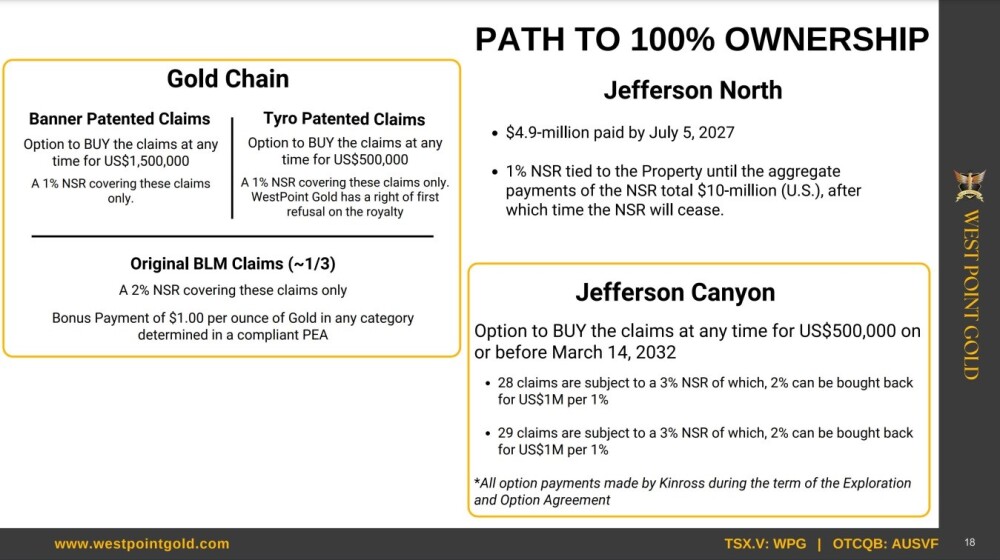
Finally, this page shows the path to ownership of the properties.
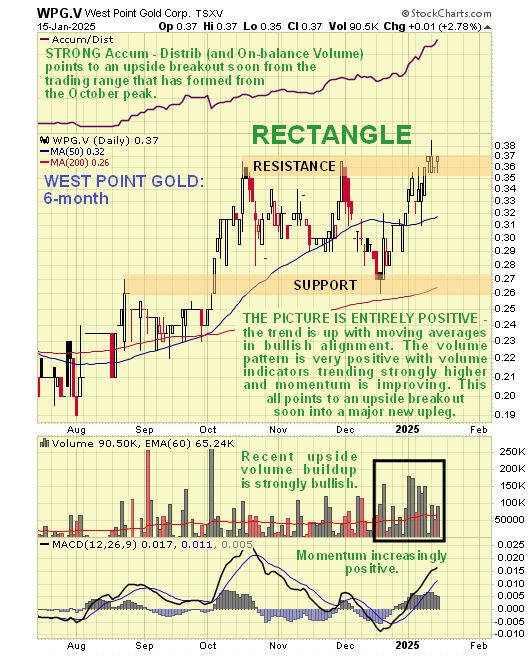
The stock charts for West Point Gold are entirely positive — they show a stock that is just starting to ascend out of a low base pattern on increasing upside volume.
Starting with the 6-month chart, we can see that an uptrend has already become established, with the price ascending out of a low last Summer. Following a breakout move higher on robust volume early in October, the stock has settled into a rectangular trading range, which — with good reason — is viewed as a consolidation pattern that will lead to a renewed advance.
An especially bullish point to observe is the way that, following a classic reaction back to test support above the rising 200-day moving average in mid-December, the price has been advancing on a marked pickup in upside volume that has driven the Accumulation line (and On-balance Volume, not shown) strongly higher. This is a powerful indication that the price is en route to break out of this trading range to the upside soon.
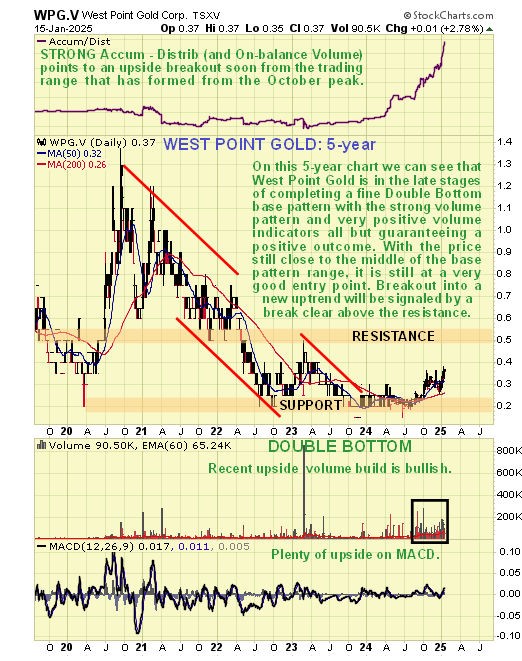
Zooming out via the 5-year chart enables us to see that the advance from last Summer has been due to the price rising up to complete the second low of the large Double Bottom pattern shown, whose first low formed in late 2022 and which followed a severe bear market from the mid-2020 peak.
This chart makes more clear the significance of the upside volume buildup of the past six months or so that has driven both volume indicators, the Accumulation line shown here and the On-balance Volume line, steeply higher, which is viewed as very bullish and as a strong indication that West Point Gold is powering up for a major bull market.
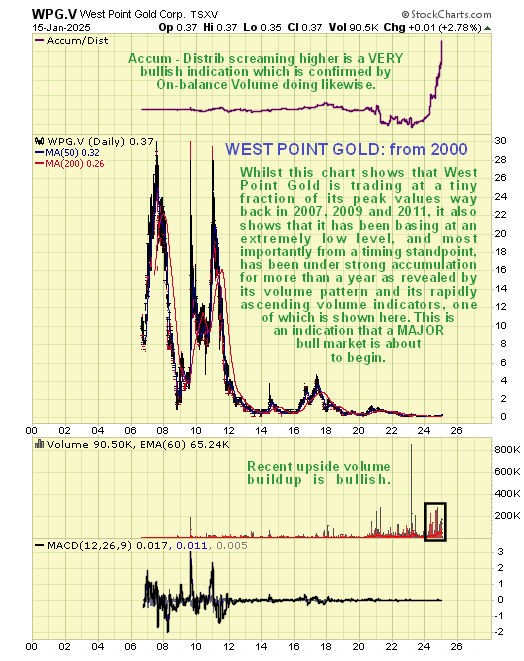
Whilst the very long-term charts going all the way back to 2000 — the stock started trading in 2007 — are of limited use technically, they do make several things clear.
Starting with the long-term arithmetic chart going back to 2000, we see that West Point Gold is currently trading at a historically very low level since it got as high as CA$30 back in 2007 and 2009 and almost made this level again in 2011, which means that at its current price, it is at almost a 99% discount to its price at its peak.
We see again on this chart the volume buildup of the past 6 months and the dramatic rise in the Accumulation line which looks to be screaming higher here and is, as already pointed out, a powerful indication that a major bull market is incubating.
It is also worth looking briefly at the long-term logarithmic chart going back to 2000, so for the same time period as the arithmetic chart above. The main reason for looking at this chart is that it "opens out” the base pattern and allows us to see that it started to form as far back as 2013 and that it has taken the form of a giant Double Bottom, whose first low occurred in 2013 – 24 and whose second low occurred in 2020, 2022 and last year — note that the lesser order Double Bottom that we earlier observed on the 5-year chart constitutes the latter part of the second low of this much larger Double Bottom.
The fact that the second low of the giant Double Bottom occurred at a slightly lower level than the first low, which makes the pattern somewhat more difficult to spot, is unimportant, especially given the heavier upside volume that has recently been kicking in and driving volume indicators steeply higher.
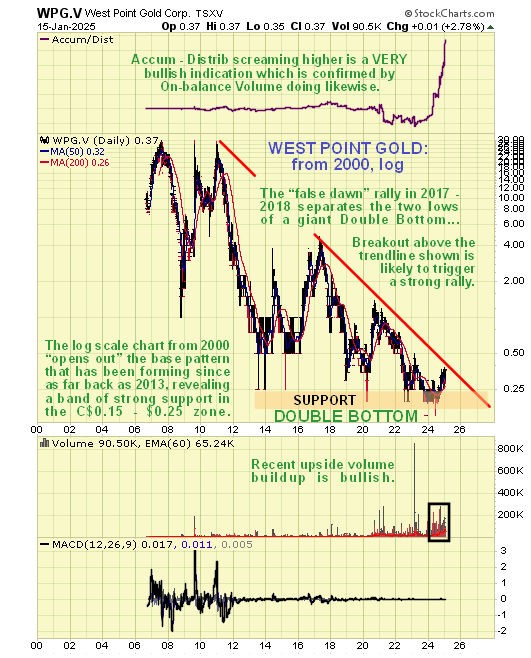
The conclusion is that West Point Gold is in the earliest stages of a major bull market that we can expect to unfold against the background of a broad sector bull market, and with it still relatively very close to its lows, there is believed to be everything to go for with the prospect of very substantial percentage gains going forward and it is rated an Immediate Strong Buy for all time horizons.
West Point Gold's website.
West Point Gold Corporation (WPG:TSX; WPGCF:OTCQB) closed for trading at CA$0.355, US$0.24 on January 15, 2025.
| Want to be the first to know about interesting Gold investment ideas? Sign up to receive the FREE Streetwise Reports' newsletter. | Subscribe |
Important Disclosures:
- For this article, the Company has paid Street Smart, an affiliate of Streetwise Reports, US$3,000.
- As of the date of this article, officers and/or employees of Streetwise Reports LLC (including members of their household) own securities of West Point Gold Corp.
- Author Certification and Compensation: [Clive Maund of clivemaund.com] was retained and compensated as an independent contractor by Street Smart to write this article. Mr. Maund is a technical analyst who analyzes historical trading data and he received his UK Technical Analysts’ Diploma in 1989. The recommendations and opinions expressed in this content reflect the personal, independent, and objective views of the author regarding any and all of the companies discussed. No part of the compensation received by the author was, is, or will be directly or indirectly tied to the specific recommendations or views expressed.
- Statements and opinions expressed are the opinions of the author and not of Streetwise Reports, Street Smart, or their officers. The author is wholly responsible for the accuracy of the statements. Streetwise Reports requires contributing authors to disclose any shareholdings in, or economic relationships with, companies that they write about. Any disclosures from the author can be found below. Streetwise Reports relies upon the authors to accurately provide this information and Streetwise Reports has no means of verifying its accuracy.
- This article does not constitute investment advice and is not a solicitation for any investment. Streetwise Reports does not render general or specific investment advice and the information on Streetwise Reports should not be considered a recommendation to buy or sell any security. Each reader is encouraged to consult with his or her personal financial adviser and perform their own comprehensive investment research. By opening this page, each reader accepts and agrees to Streetwise Reports' terms of use and full legal disclaimer. Streetwise Reports does not endorse or recommend the business, products, services, or securities of any company.
For additional disclosures, please click here.
Clivemaund.com Disclosures
The above represents the opinion and analysis of Mr. Maund, based on data available to him, at the time of writing. Mr. Maund's opinions are his own, and are not a recommendation or an offer to buy or sell securities. As trading and investing in any financial markets may involve serious risk of loss, Mr. Maund recommends that you consult with a qualified investment advisor, one licensed by appropriate regulatory agencies in your legal jurisdiction, and do your own due diligence and research when making any kind of a transaction with financial ramifications. Although a qualified and experienced stock market analyst, Clive Maund is not a Registered Securities Advisor. Therefore Mr. Maund's opinions on the market and stocks cannot be construed as a recommendation or solicitation to buy and sell securities.


