No sooner had I sent out the GGMA 2025 Forecast Issue with a section devoted to "Buy Canada" than the very reason I am a bull on this frozen piece of real estate decided to resign. Citing regime change as a primary driver for Canadian investment, I was looking out to October 2025, bracketed with "if not sooner" as a possible time horizon for an election. Now that Trudeau has announced his resignation, there could be a major federal election as early as May after the Trudeau-less Liberal party is able to replace the departing head honcho.
Why do I welcome such an event? Look no further than last Thursday's trading session on the TSX and TSXV. While the U.S. markets were closed for a day of mourning for former president Jimmy Carter, who passed away at the tender age of 100 on December 29, I watched paint drying on the walls of the Canadian exchanges as many of my favorite names did not even trade all day long.
I never realized just how pathetic the Canadian exchanges have become until last Thursday, and I attribute that to the regulatory regime that has grown oppressively under eight years of leftist rule. As a card-carrying climate-change advocate, Justin Trudeau has turned a blind eye to the Canadian resource sector with particular vitriol for the western oil patch, followed closely by mining operations in Ontario and B.C, where First Nations are given preferential treatment in all facets of negotiations regarding the exploration and exploitation of mineral resource on lands deemed to be part of the First Nations' birthright (which is essentially the rest of Canada).
It is why the Province of Quebec is the best province in Canada in which to explore for and develop mineral deposits; long ago, they set the rules separating mineral wealth and surface rights such that a company can remove ore as long as it leaves the surface conditions in the same shape in which they existed prior the drilling and/or digging.
Attitudes toward entrepreneurism originate at the top of government, and they trickle down through various ministries and departments until they ultimately reach the front-line staff that deal with the publicly traded companies that seek approvals, permits, and rulings in the quest to find the raw materials necessary in order to service the Canadian economy. When there is a pervasive tone of condescension and disapproval of industries like oil and gas or mining emanating from the top, it is felt immediately by those attempting to secure funding or permits with which to carry out their missions.
With Conservative Party Leader Pierre Poilievre ahead in the polls by a rather historic margin, it is setting up a regime change as early as May and, with that, a shift in sentiment that will most certainly be felt in boardrooms across Canada. It will also be felt by foreign corporations looking to invest in Canada and that is of utmost urgency.
Perhaps with a change in government, volume will return to the Canadian exchanges because international "flow" is currently non-existent and without it, institutional money stays away.
Stocks
Since very early December, the advance-decline line has been fading with breadth abysmal. As money fled the small-cap indices, it gravitated back once again to the large-cap "Mag Seven" group, which allowed the overweighted major averages like the S&P 500 to carry a façade of strength into year-end but under the hood, markets were unraveling, as we noted here during most of December.
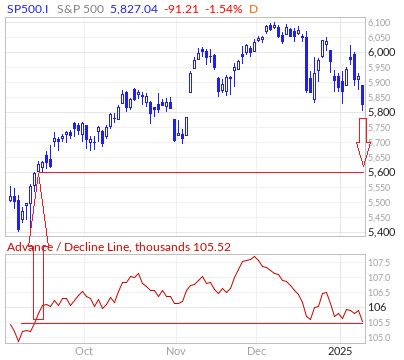 Volatility finally poked its head above 20 on Friday but quickly pulled back as the S&P 500 came off the lows at 5,807, closing at 5,827.
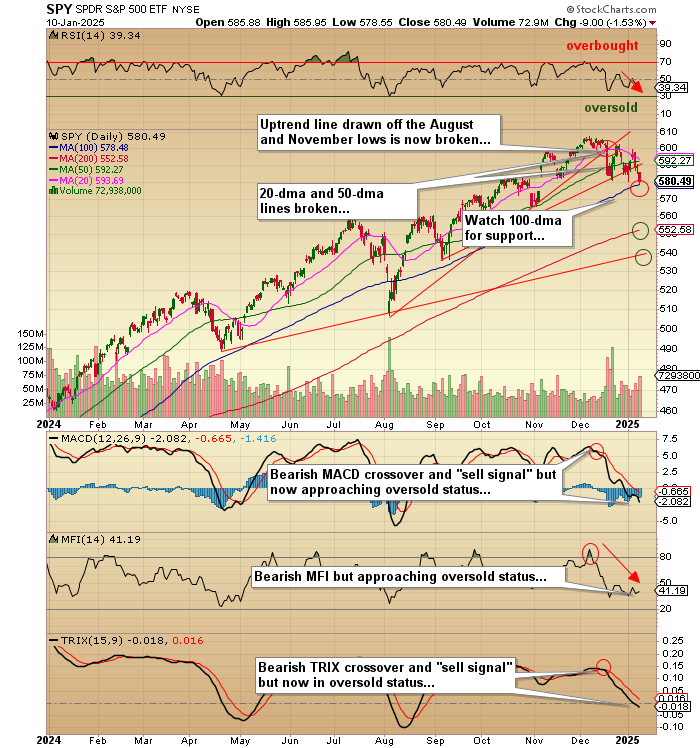
The200-dma for that index lies just below at 5,820.22 and below that the 200-dma at 5,572.58, which looks like fait accompli with breadth so poor and bond yields spiking. The A/D line is now back at September levels when the S&P 500 was trading at around 5,600 so it is not a stretch to expect a move to test the 200-dma. The culprit remains inflationary expectations, which hit a multi-month high on Friday, sending the 30-year bond yield to within a hair of 5%, which is the proverbial "red line" for equities. Stocks cannot continue to remain "bid" with long yields rising this sharply as portfolio modeling forces money out of stocks and into bonds.
Mind you, a similar rebalancing that I expected in December included selling in equities but was absent in any visible rotation into bonds, which have been leaking badly for the past five weeks.
The ETF that tracks the S&P 500 (SPY:US) has broken numerous uptrend lines and has now given up the 20-dma and 50-dma levels. I used the SPY January $600 put options as our proxy for the rebalancing trade, where I sold stock and bought bonds through the TLT January $90 calls, thinking (incorrectly) that I would get a sharp rally in bond prices as trillions of dollars in the S&P rotated into bonds for year-end but luckily, I was only half right as bonds got hammered mercilessly right through to last Friday taking the TLT:US to $85.16 down over $8 from my entry on December 9 at $93.30.
The same day, the SPY:US was at $605.00 and went out at $ $580.49. The option spread, put on for a net debit of $10.45, went out at $19.55 on Friday, and while it worked beautifully, the reasons were the complete opposite of what I expected. The seasonal rebalancing that happens most years, along with the Santa Claus Rally, decided to take an early vacation in December, resulting in a washout in both stock and bond prices. In the end, sometimes you need to catch a break, and I certainly did in December.
The "January Effect" is usually reliable as well as the small-caps historically outperform their larger-cap brethren due to the disappearance of tax-loss selling in January providing a gravitational lift to the little guys best represented by the ETF for the Russell 2000 (IWM:US) which closed on December 9 at $237.03. This trade set-up used the SPY January $590 puts in a synthetic short position on large-caps, while the IWM January $245 calls for a net debit of $8.75.
Expecting a big lift in the Russell small-caps after the Christmas break, the New Year has seen a broad liquidation in small-caps with the IWM:US going out at $216.83. The spread also turned a profit, going out at a net $11.19 on Friday, but for reasons once again totally unexpected.
Needless to say, a great many professional investors have been burned in the past five weeks as none of the seasonal trends kicked in.
While the Santa Claus Rally was a bust, the First Five Days indicator registered a fractional gain only to lose the level on Day Six which was a great credit to the manipulative forces of the Wall Street crowd. Had we got a negative FFD, there would have been a strong probability of a negative January, and as you have all heard from the pundits for the past few weeks, a negative January Barometer issues an 83.8% probability of a down year for stocks. As it stands, the mixed result of SCR and FFD has put the odds of a down year at 59.5% but with an average gain of only 2.9%, a forecast with which I totally disagree.
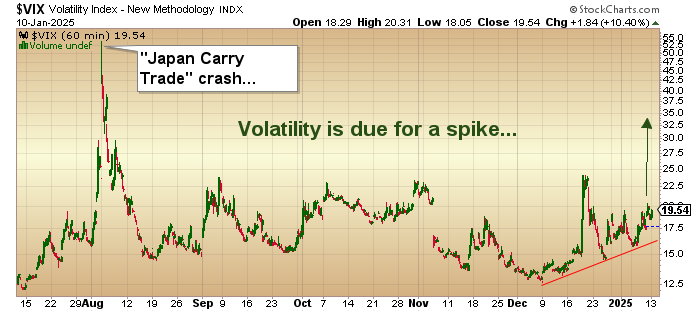
I do not pretend to be the resident expert on gamma and delta or skew or reflexivity, but the one thing that 45 years of carving up markets has taught me is to never ignore my instincts. I am getting that eerie sense of impending doom about to descend upon the equity markets where everything that worked in 2022-2024 (such as large-cap "Mag Seven," NASDAQ, and crypto) is going to get vaporized while everything that did not work (Gold Miners, Resource stocks, Energy, the entire TSX Venture Exchange) is going to come alive.
The best way to defend against a "black swan" event is through volatility with specific use of either call options on the CBOE Volatiliy Index (VIX:US) of the UVIX:US. As inauguration day approaches, I suspect that many portfolio managers are going to move to hedge portfolios before they get to see or feel the impact of tariffs, deportations, or any other of the whims of this highly vindictive president are revealed.
Most importantly, since the bulk of GDP and employment growth in 2024 was related to the government, the Musk-Ramaswamy team heading up the "Department of Government Efficiency" ("DOGE") is not going to be in the business of stimulating the economy if they are looking to cut "waste" from the current budget. Cutting "waste" means cutting the flow of money and reducing the flow of new jobs designed in 2024 to enhance re-election chances. Lastly, since Trump has no chance of returning to office due to term limits, he wants to leave a lasting legacy of "swamp-draining," and that cannot be expected to occur smoothly or without impact on the stock markets in the U.S. and globally.
Gold and Silver
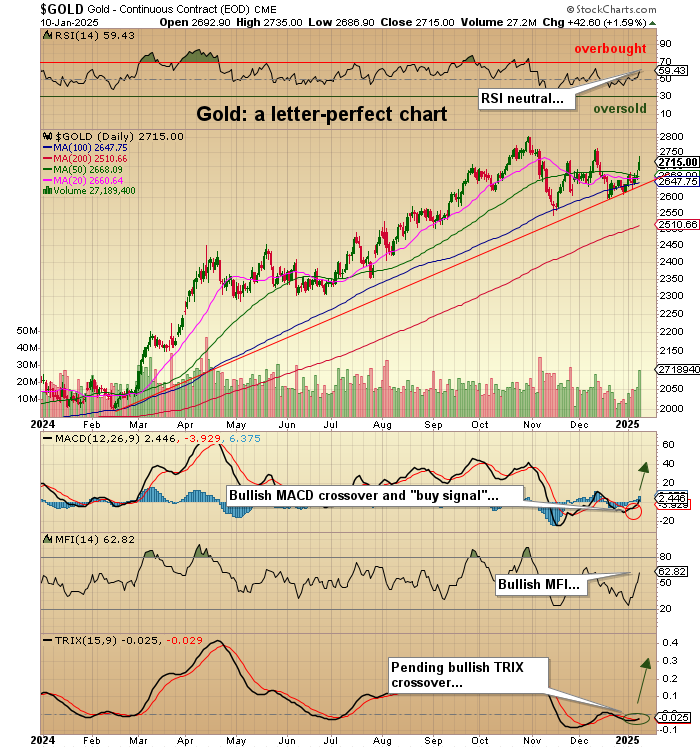
When I go through page after page of charts on stocks, bonds, and commodities, it is rare that I come across anything resembling a "perfect" chart, so when I say that the technical pattern for spot gold is "perfect," I do not use the term lightly. I am also afraid of jinxing it in the way you never breathe the word "shutout" between the second and third periods if your goalie has one going into the third.
Superstitious or not, the price of gold has a chart pattern that suggests higher prices over the near term and much higher prices looking out to year-end and beyond.
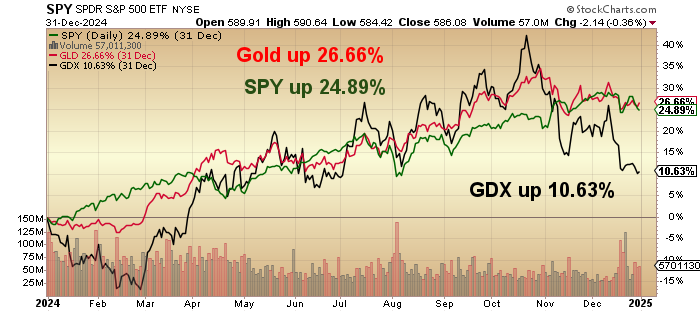
People tend to forget that gold outperformed the S&P 500 in 2024, but you only got to take home bragging rights if all you owned was the physical metal (or the ETF GLD:US) because the mining stocks were avoided like Justin Trudeau at a United Nations dinner. GDX:US could only muster a 10.63% gain despite record global gold prices and in all currencies. Global mining costs are the perceived culprit, but I think the institutional money flows were influenced by distractions like the Mag Seven and Bitcoin more than any of us suspect.
Without a doubt, gold ownership is going to be the concrete in any portfolio in 2025, as nothing in the new contractionary policies of the Trump Administration can hurt it. In the case of silver, it is a far different story. Many of the desperate silver bulls pointed to industrial demand driven by the Electrification Movement as a reason to expect physical offtake to increase in this decade. Every time I read a report or watch a podcast with some "analyst" salivating over the impending move to $200 per ounce based on a global shortage, I keep pinching myself wondering where they get this absurd notion that silver supplies are "tight". Every base metal miner in the world has slag heaps with more silver than the primary producers could ever produce in a single year.
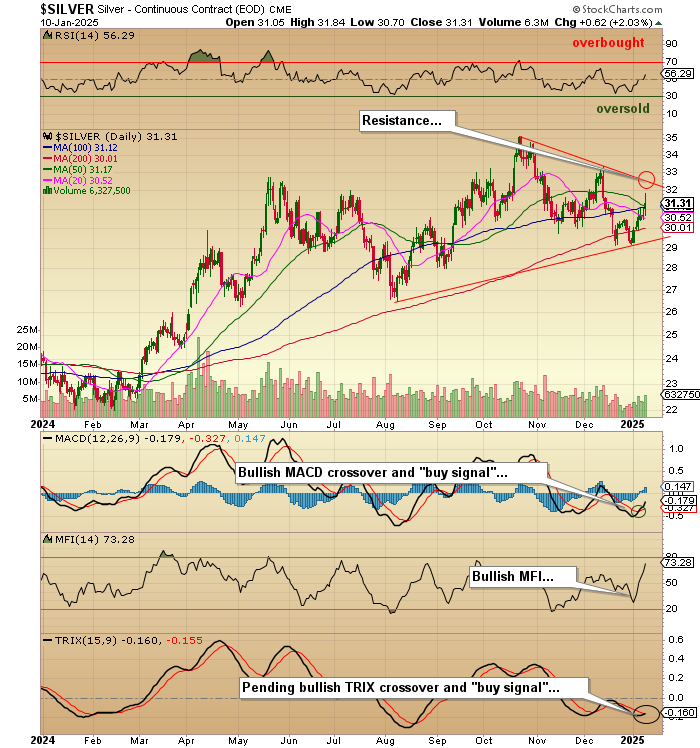
Nevertheless, the chart of silver looks better today than it has in some time but still lags the action in gold by a wide margin, which is why the gold-silver ratio remains stuck in the high 80s despite legion upon legion of email blasts from the silver bugs bombarding my inbox. I need silver to get above the downtrend line at around $32 per ounce and then convincingly break out above the 2024 high of around $35. It tried back in late October only to get summarily repelled by the bullion bank behemoths back under $30 within days.
For now, I am staying with gold, but I will definitely keep silver on my radar until I see it break free from the shackles of bullion bank suppression.
Copper
My second favorite metal for 2025 executed a stunningly impressive reversal to the upside last week. I was convinced it was headed down to test the August lows at $3.95/lb. but it performed a perfect outside reversal and is now above the downtrend line drawn off the highs in May and September. My largest holding in the junior exploration in the junior development and exploration space are copper-and-gold-centric, so it is with great relief that I welcome that development.
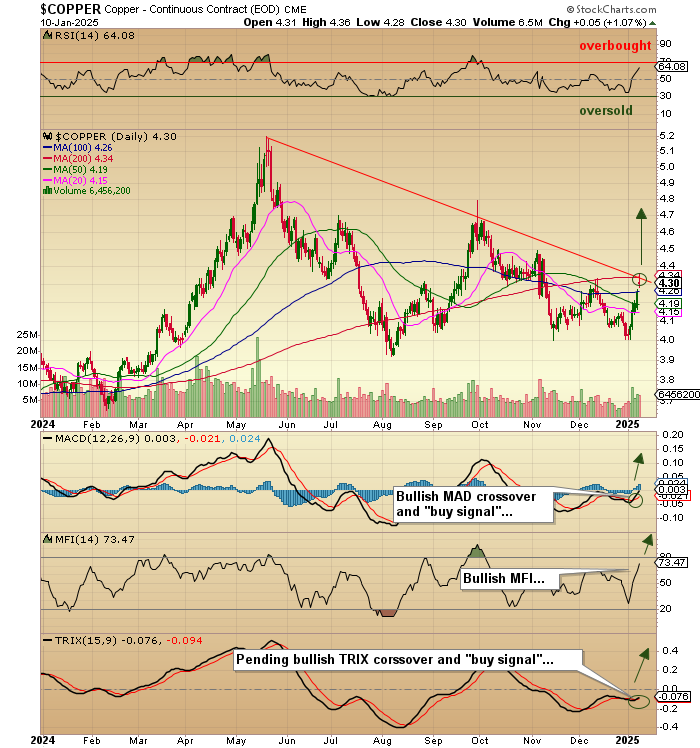
It now looks as though the September highs around $4.60 are in the crosshairs, but I will not chase it up here until after the January 20th inauguration, and we all get a peek at what the Trump team has in store for global copper demand by way of tariffs.
We all know the bullish copper narrative of escalating demand against diminishing supply and declining grades, but a global trade shock will blow that narrative away in a heartbeat.
Special Situations
The only development that jumps off the page this weekend is the knowledge that the long-awaited PEA for Getchell Gold Corp. (GTCH:CSE; GGLDF:OTCQB) is about to be released. I have owned this name for what feels like an eternity and have watched in amazement as gold prices moved from $1,200 in 2018 (when I first bought in) to over $2,800 in 2024 with zero impact on the share price.
Sure, they have raised a ton of money to secure the 2.317 million ounce Fondaway Canyon deposit in Nevada, but with the market cap of a mere $22 million, those ounces are being valued at $9.77 per ounce which, for an optimum jurisdiction like Nevada, is absurd.
On the assumption that the upcoming PEA confirms the economic viability of the project, I have been adding to my position in the last few weeks looking for either the market or a suitor willing to pay closer to $50 per ounce to own a deposit-wide open along strike and to depth to add additional ounces with Tier One potential.
| Want to be the first to know about interesting Base Metals, Silver, Critical Metals and Gold investment ideas? Sign up to receive the FREE Streetwise Reports' newsletter. | Subscribe |
Important Disclosures:
- As of the date of this article, officers and/or employees of Streetwise Reports LLC (including members of their household) own securities of Getchell Gold Corp.
- Michael Ballanger: I, or members of my immediate household or family, own securities of: All. My company has a financial relationship with: Getchell Gold Corp. I determined which companies would be included in this article based on my research and understanding of the sector.
- Statements and opinions expressed are the opinions of the author and not of Streetwise Reports, Street Smart, or their officers. The author is wholly responsible for the accuracy of the statements. Streetwise Reports was not paid by the author to publish or syndicate this article. Streetwise Reports requires contributing authors to disclose any shareholdings in, or economic relationships with, companies that they write about. Any disclosures from the author can be found below. Streetwise Reports relies upon the authors to accurately provide this information and Streetwise Reports has no means of verifying its accuracy.
- This article does not constitute investment advice and is not a solicitation for any investment. Streetwise Reports does not render general or specific investment advice and the information on Streetwise Reports should not be considered a recommendation to buy or sell any security. Each reader is encouraged to consult with his or her personal financial adviser and perform their own comprehensive investment research. By opening this page, each reader accepts and agrees to Streetwise Reports' terms of use and full legal disclaimer. Streetwise Reports does not endorse or recommend the business, products, services or securities of any company.
For additional disclosures, please click here.
Michael Ballanger Disclosures
This letter makes no guarantee or warranty on the accuracy or completeness of the data provided. Nothing contained herein is intended or shall be deemed to be investment advice, implied or otherwise. This letter represents my views and replicates trades that I am making but nothing more than that. Always consult your registered advisor to assist you with your investments. I accept no liability for any loss arising from the use of the data contained on this letter. Options and junior mining stocks contain a high level of risk that may result in the loss of part or all invested capital and therefore are suitable for experienced and professional investors and traders only. One should be familiar with the risks involved in junior mining and options trading and we recommend consulting a financial adviser if you feel you do not understand the risks involved.


