Volt Lithium Corp. (VLT:TSV; VLTLF:US; I2D:FSE) is a company that has developed the technology and production processes to efficiently extract saleable lithium from oilfield brine, transforming what was a worthless contaminant into a profitable by-product and this is an excellent time to invest in it because it has brought these processes through to the production stage just when the government is looking to onshore lithium production and at a point when the lithium price looks set to advance anew with demand set to ramp up.
Before reviewing the stock charts for Volt to see why it looks so attractive as an investment, we will first briefly consider the outlook for lithium itself and for U.S. producers before looking specifically at Volt Lithium.
The first and crucially important point is that demand for lithium is set to grow for many years to come, as this slide from the company's latest investor deck makes clear.
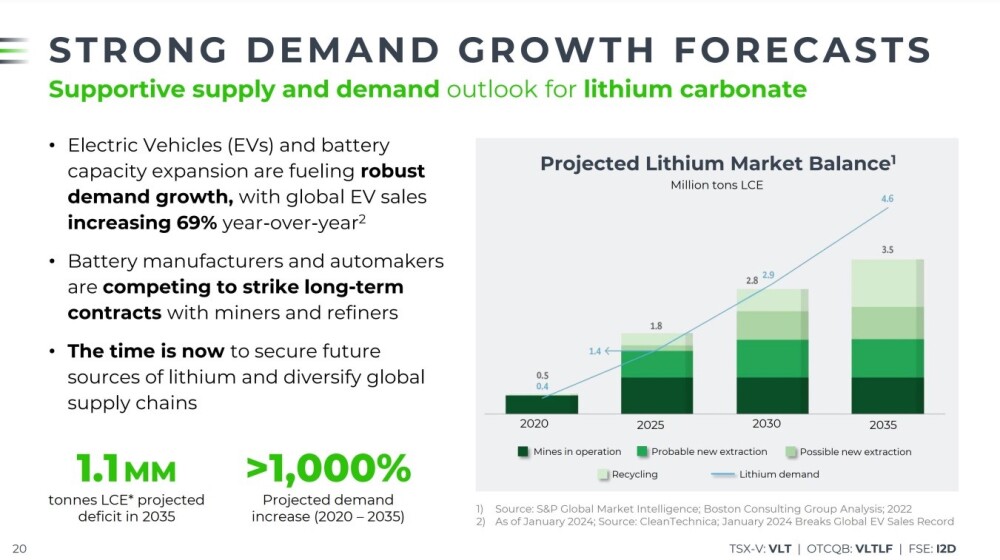
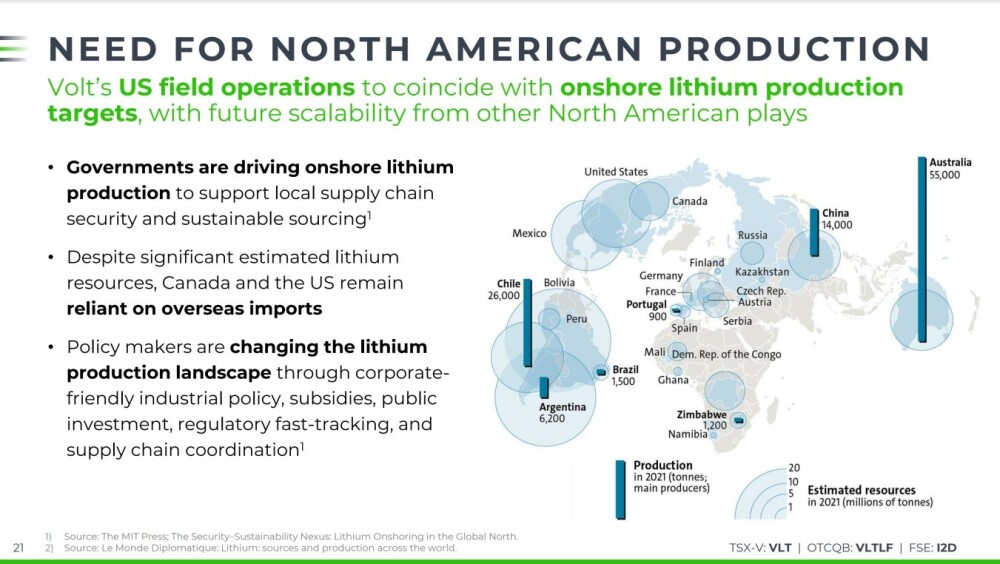
For various reasons, governments — notably the U.S. government — are looking to onshore lithium production and are taking steps to expedite domestic production.
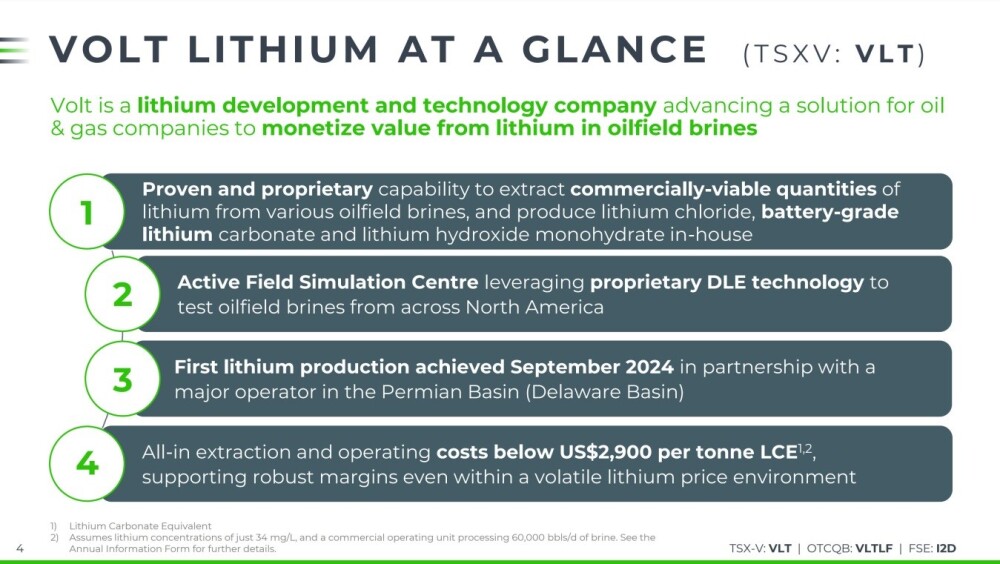
This slide provides an overview of the company:
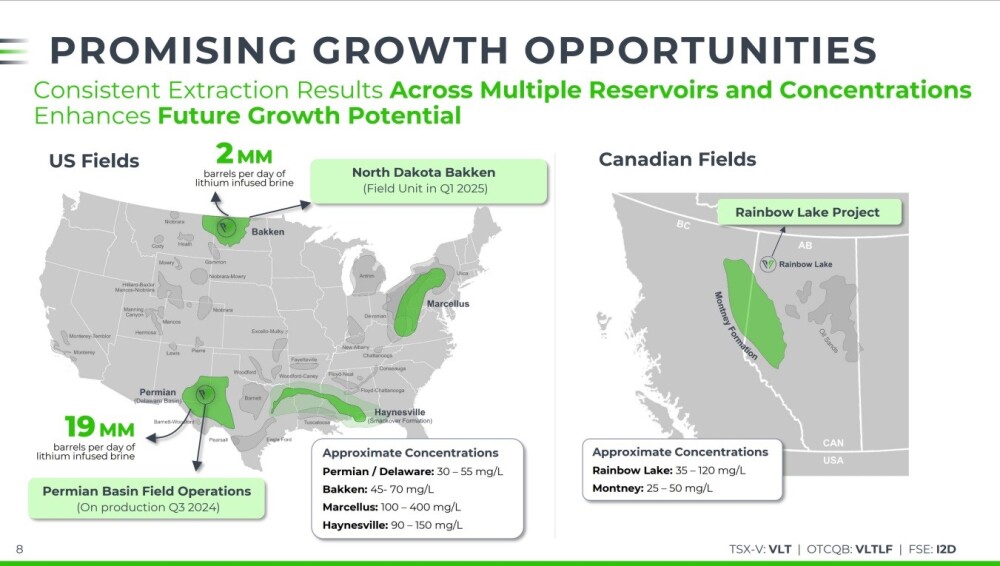
The areas where the company is active in North America, which are of course oil-bearing areas, are shown on the following slide and it is noteworthy that the company has already started lithium production in collaboration with established operator Delaware Basin in the Permian Basin.
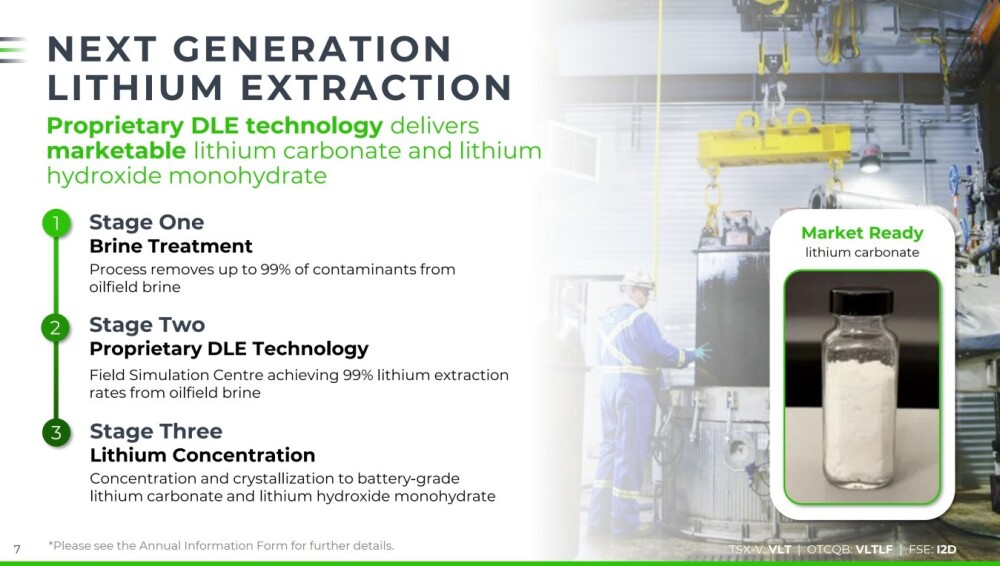
The process of extracting lithium from oilfield brine is a three-stage process, as set out on this slide:
The company has established a Field Simulation Center in which it has been able to develop and perfect its proprietary technology and processes and where oilfield brines from across North America can be tested, regardless of their lithium concentrations.

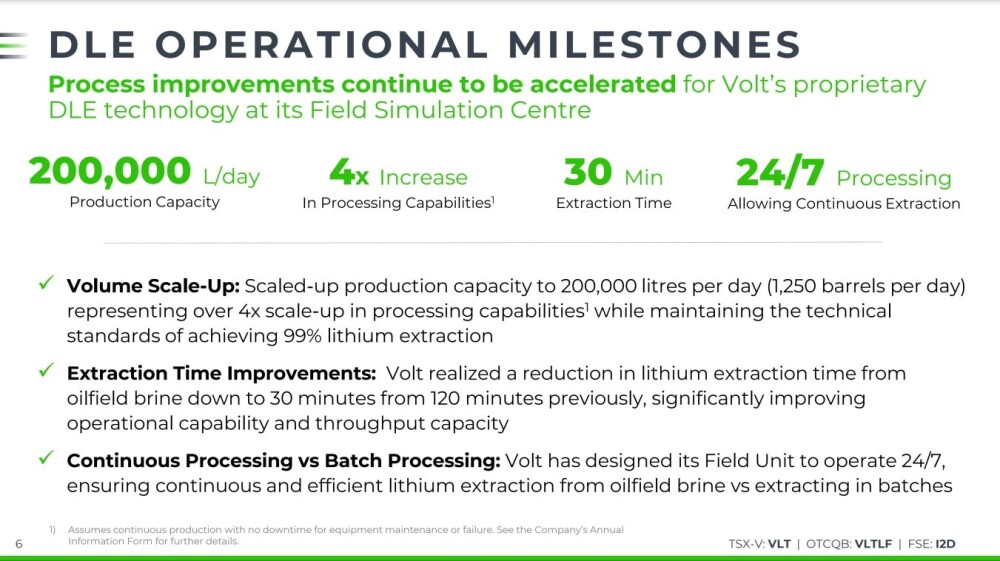
The Field Simulation Center has enabled the company to perfect its DLE (Direct Lithium Extraction) process and achieve the following operational milestones.
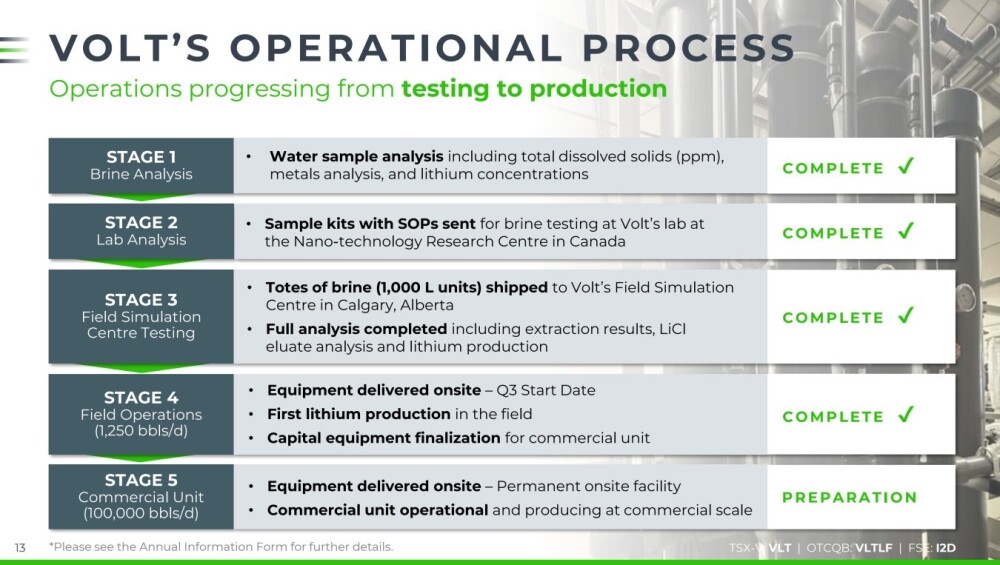
On this next slide, we see that Volt has worked its way methodically through all the stages of development to arrive at the point where its technology and processes are ready to be deployed and put into commercial production.
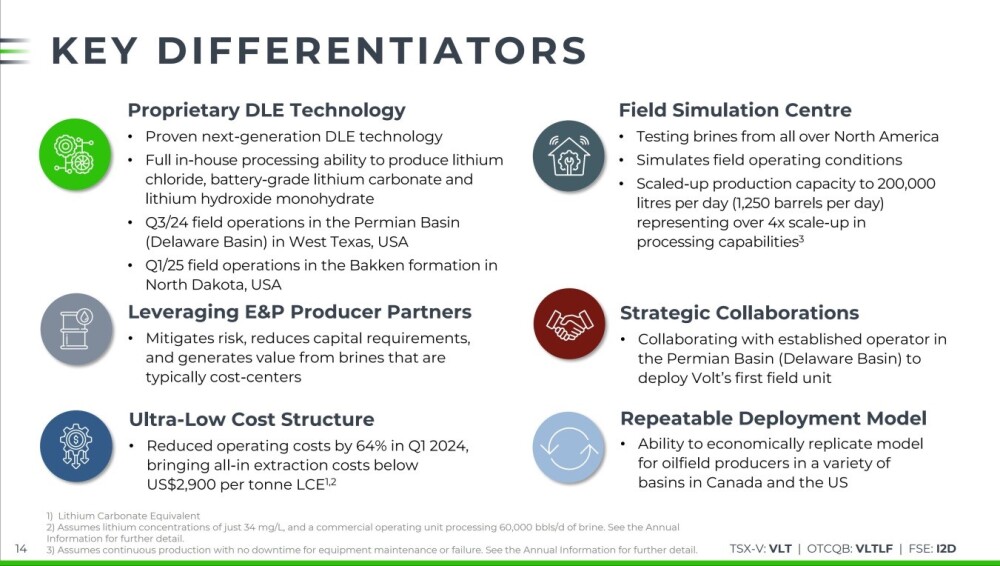
This slide sets out the key differentiators of the company — of particular note are the reduced operating costs and scaled up operating capacity and the ability to economically replicate the model for oilfield producers in various basins across Canada and the U.S.
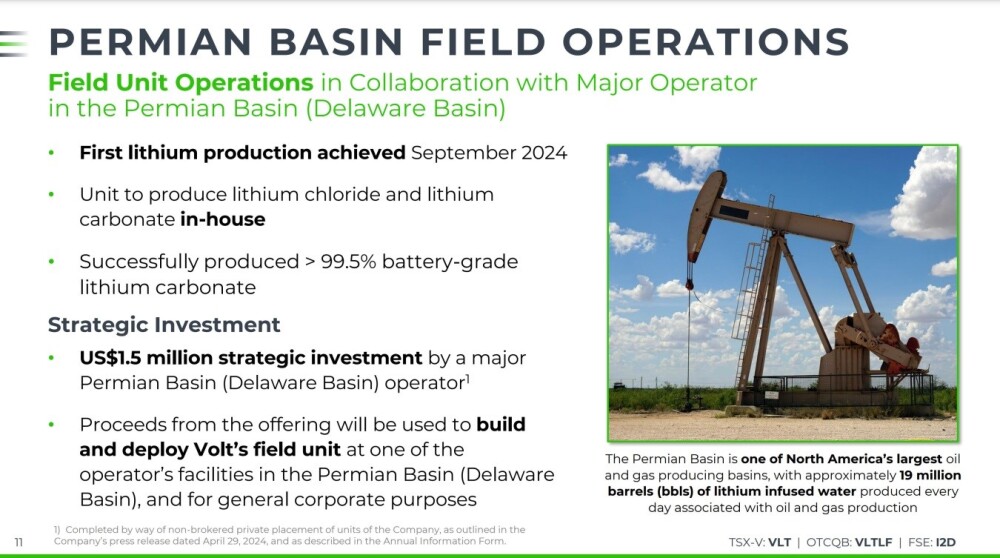
Spearheading the practical application of the company's technology is its field operations in collaboration with major operator Delaware Basin in the Permian Basin.
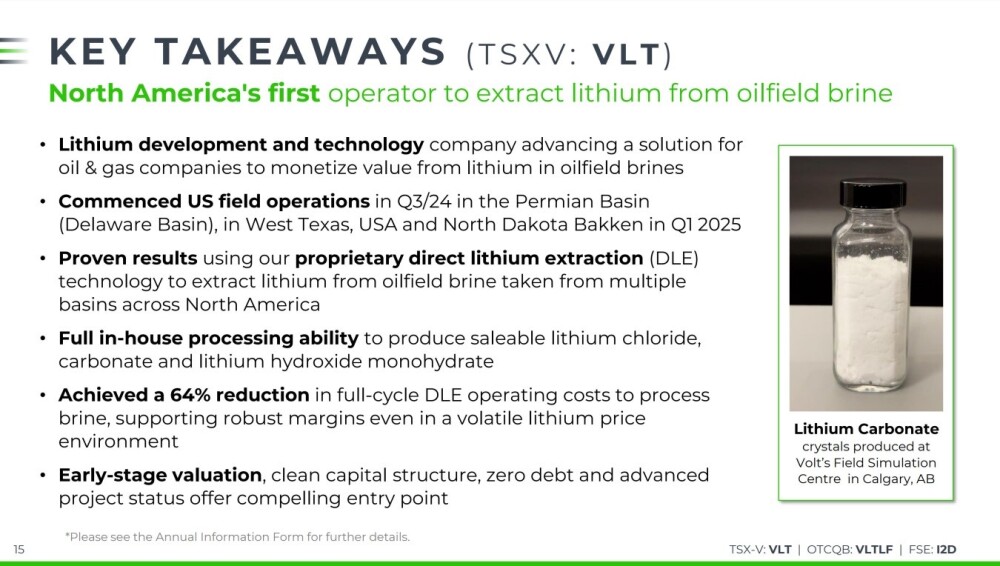
Volt Lithium is North America's first operator to extract lithium from oilfield brine and the key takeaways about the company are set out on this last slide.
There is some additional information in the company's investor deck that is not included here for space reasons. In particular, information on the North Dakota Bakken Field Study and on the management of the company.
Now, we turn to examine the stock charts for Volt Lithium.
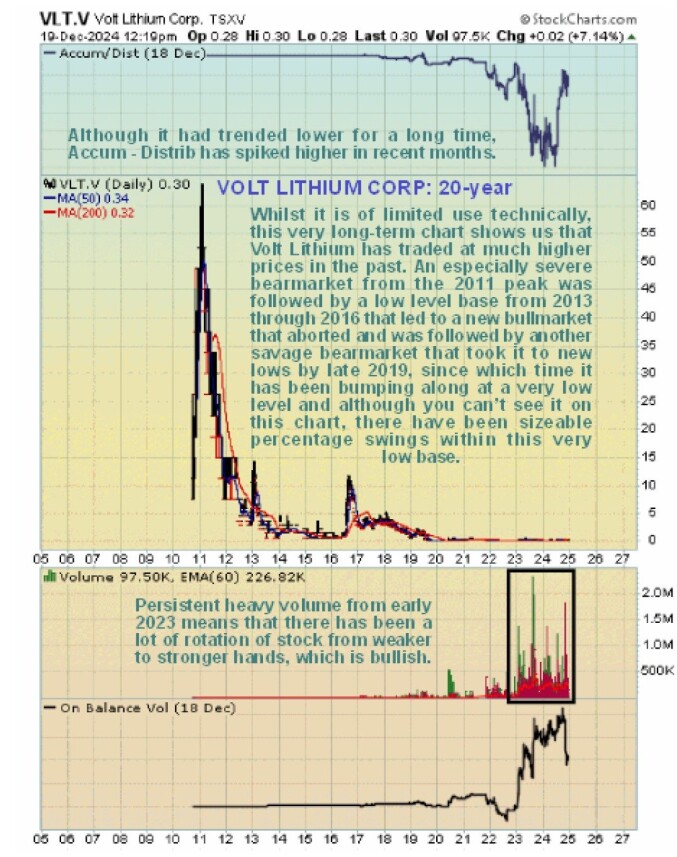
Starting with the very long-term 20-year chart, we see that Volt traded at vastly higher prices many years ago. Back early in 2011, it had a high at about CA$65, which peak was followed by an extremely severe bear market, and apart from a significant recovery rally towards the end of 2016, it has essentially been trading sideways for many years, marking out a low base pattern.
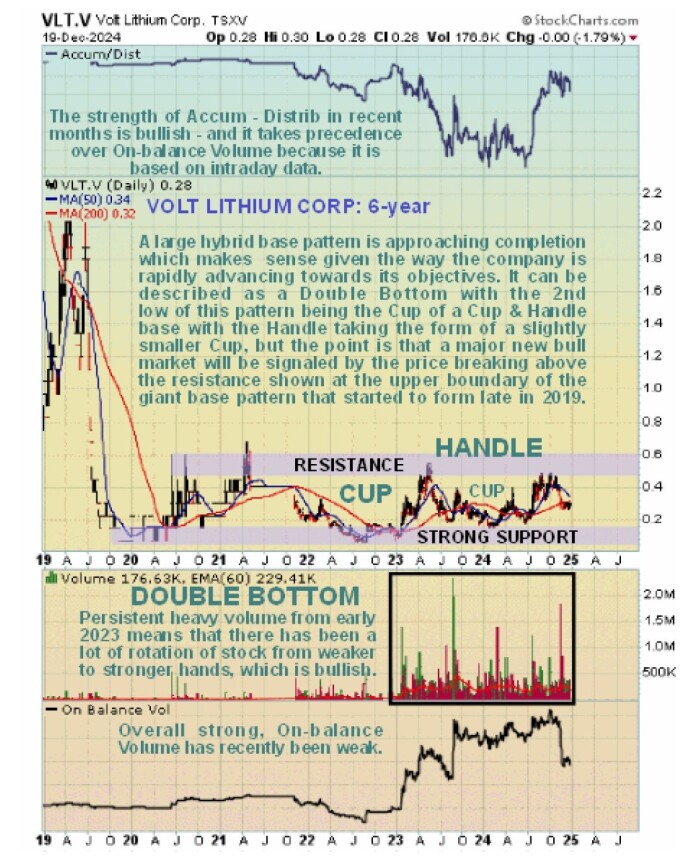
The 6-year chart opens out the latter part of the base pattern and enables us to see that from mid-2019, a giant Double Bottom has formed whose dip to complete its second low can also be described as a Cup with a Handle to complement this Cup-forming beneath a clear line of resistance roughly approaching CA$0.60 ever since.
So, it really can be described as a hybrid base pattern. Of particular note on this chart is the big volume buildup from the start of last year — this shows that a lot of stock has changed hands during this period, which is generally bullish as the new owners will be less inclined to sell until they have turned a profit and the bullish implications of this are augmented by the strong Accumulation line in recent months. A key takeaway from this chart is that the stock will really get moving once it breaks clear above the resistance at the top of the base pattern, which, as we earlier observed, is at and approaching CA$0.60.
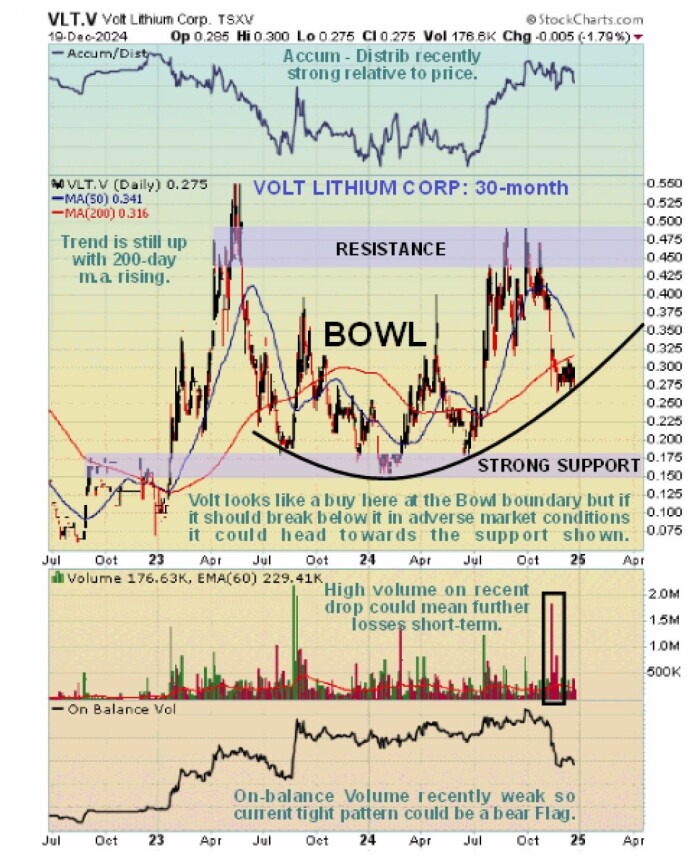
Zooming in now via the 30-month chart, we see that following the April peak, the price corrected back hard and then steadied and gradually started to trend higher again above the support of a Bowl pattern.
Normally, we would expect this Bowl pattern to get it moving higher again after its recent drop to meet it, but there are two factors that suggest that we may see further short-term weakness before this corrective phase is done that we will now look at on a 6-month chart where we can see more clearly what is going on.
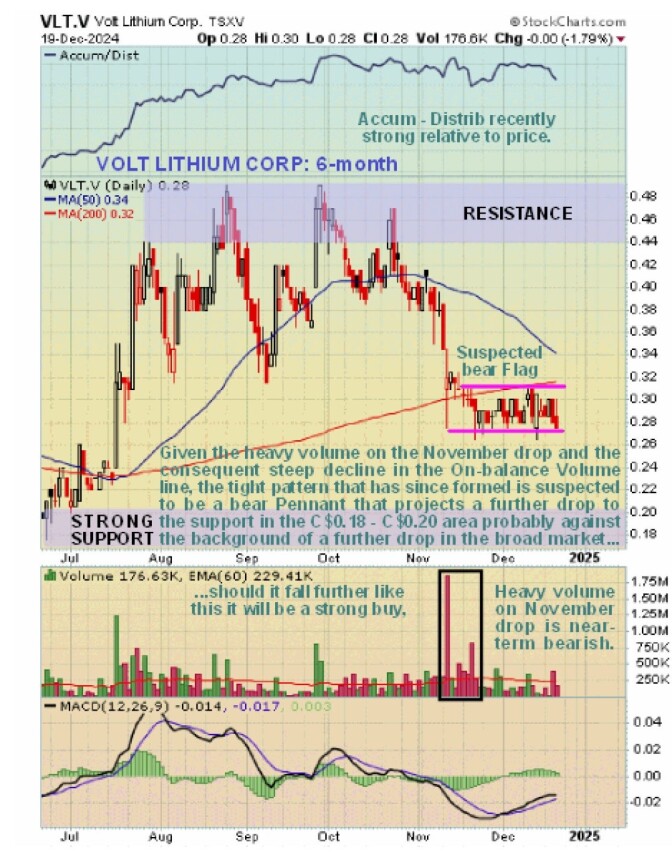
On the 6-month chart we can see that there was high volume on the November drop that caused a steep decline in the On-balance Volume line (shown on the 30-month chart above).
This implies that the current tight trading range that has formed since mid-November is probably a bear Flag that will lead to a further sharp drop short-term, towards or to the support in the CA$0.18 – CA$0.20 where, given the very positive fundamentals of the company, the stock will be a strong buy. The trigger for such a drop may well be further near-term weakness in the broad stock market.
The conclusion is that while the charts suggest that there is the risk of a further drop near-term, likely caused by renewed weakness in the broad market, this is not regarded as a cause for concern.
On the contrary, given the very positive fundamentals of the company and the stage it is at in its development any such further weakness will be viewed as an opportunity to buy or add to holdings and it is considered worth going overweight on this one. Equally, if it should buck the trend and rise away from the Bowl boundary shown on our 30-month chart, it will also be a Strong Buy.
| Want to be the first to know about interesting Cobalt / Lithium / Manganese and Oil & Gas - Exploration & Production investment ideas? Sign up to receive the FREE Streetwise Reports' newsletter. | Subscribe |
Important Disclosures:
- Volt Lithium Corp. has a consulting relationship with Street Smart an affiliate of Streetwise Reports. Street Smart Clients pay a monthly consulting fee between US$8,000 and US$20,000.
- For this article, the Company has paid Street Smart, an affiliate of Streetwise Reports, US$1,500.
- As of the date of this article, officers and/or employees of Streetwise Reports LLC (including members of their household) own securities of Volt Lithium Corp.
- Author Certification and Compensation: [Clive Maund of clivemaund.com] was retained and compensated as an independent contractor by Street Smart to write this article. Mr. Maund is a technical analyst who analyzes historical trading data and he received his UK Technical Analysts’ Diploma in 1989. The recommendations and opinions expressed in this content reflect the personal, independent, and objective views of the author regarding any and all of the companies discussed. No part of the compensation received by the author was, is, or will be directly or indirectly tied to the specific recommendations or views expressed.
- Statements and opinions expressed are the opinions of the author and not of Streetwise Reports, Street Smart, or their officers. The author is wholly responsible for the accuracy of the statements. Streetwise Reports requires contributing authors to disclose any shareholdings in, or economic relationships with, companies that they write about. Any disclosures from the author can be found below. Streetwise Reports relies upon the authors to accurately provide this information and Streetwise Reports has no means of verifying its accuracy.
- This article does not constitute investment advice and is not a solicitation for any investment. Streetwise Reports does not render general or specific investment advice and the information on Streetwise Reports should not be considered a recommendation to buy or sell any security. Each reader is encouraged to consult with his or her personal financial adviser and perform their own comprehensive investment research. By opening this page, each reader accepts and agrees to Streetwise Reports' terms of use and full legal disclaimer. Streetwise Reports does not endorse or recommend the business, products, services, or securities of any company.
For additional disclosures, please click here.
Clivemaund.com Disclosures
The above represents the opinion and analysis of Mr. Maund, based on data available to him, at the time of writing. Mr. Maund's opinions are his own, and are not a recommendation or an offer to buy or sell securities. As trading and investing in any financial markets may involve serious risk of loss, Mr. Maund recommends that you consult with a qualified investment advisor, one licensed by appropriate regulatory agencies in your legal jurisdiction, and do your own due diligence and research when making any kind of a transaction with financial ramifications. Although a qualified and experienced stock market analyst, Clive Maund is not a Registered Securities Advisor. Therefore Mr. Maund's opinions on the market and stocks cannot be construed as a recommendation or solicitation to buy and sell securities.


