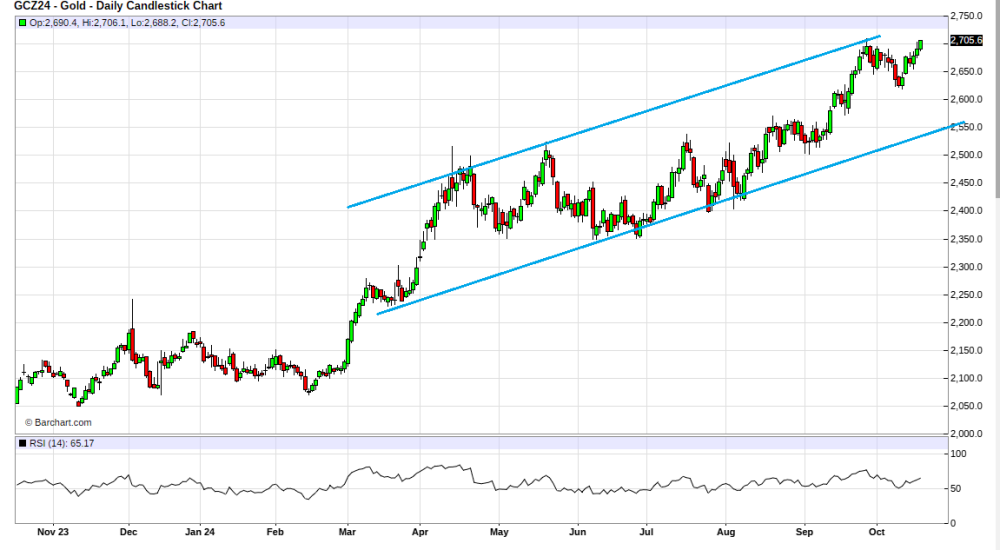
It appears the Comex gold price is breaking to new highs, but we will see where it closes today.
Regardless, it is only a matter of when it makes a new record.
With the gold stocks, we are looking at the investment opportunity of a lifetime. Since the 2,000s, there has never been such a divergence between gold and gold stocks. There is no belief in this gold rally except from the Central Banks, some big hedge funds, and a handful of retail investors. I would consider my subscribers to be among the bullish group, but I don't think so.
I notice that probably just a third of you are engaged in this bull market. I can understand we had a very long bear market, and the response in gold stocks thus far has not started any fires. That said, most investors are missing out on big gains as our 12 precious metal stocks are up +70% so far in 2024, and three of them are up over 100%. In previous gold bull markets, we have made gains on gold stocks of over 1,000%, and I know for sure this will happen again.
So where is this gold stock bull market now?
Let's look at the HUI, Gold Bugs Index. In September this index broke resistance around 330 and made a higher high. That said, I have been commenting that the key level to break is around 365. I want to see a close above 375 that will break the 2020 highs when gold's high was way lower, around $2000.
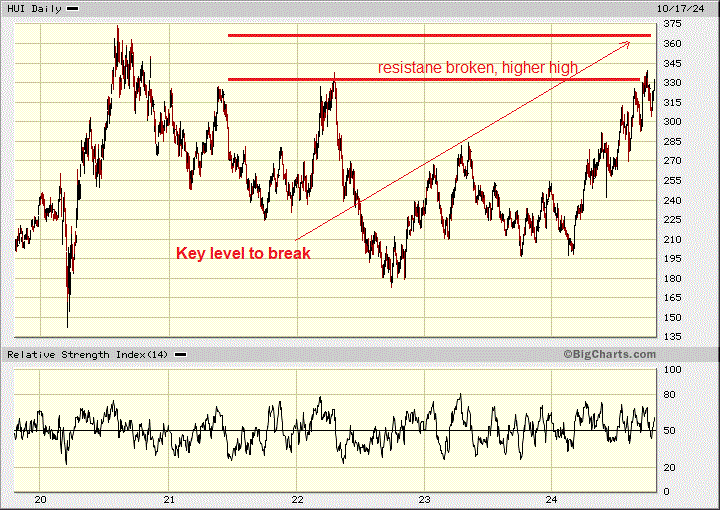
I have been showing charts of how undervalued gold stocks are compared to gold for the last two years. That changed in September, as the gold stocks did not drop below the amount gold corrected, and now their percentage performance is higher in October.
Note the GDX and GDXJ gold-stock ETFs compared to gold on the chart below. They are up between +36% and +39%, with gold up +30%.
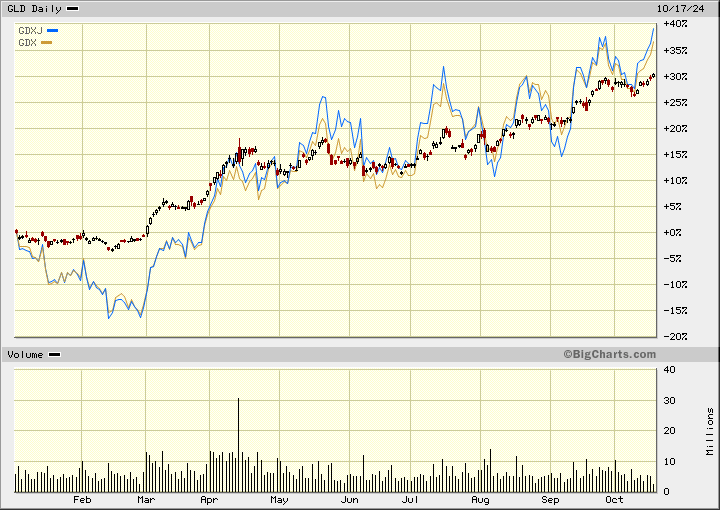
I also want to point out that selection and my 40-year experience can be leverage for you because my 12 selections have almost double the gain of the GDX and GDXJ (+70%).
Not only are most retail investors not engaged in this bull market, but they are also shorting the gold stocks with the two times bearish leveraged DUST etf. Note how volume surged into DUST after the gold stocks started to move higher in April. I compare DUST to its long counterpart, NUGT. Investors could be sitting on gains of +60% instead of -55% losses.
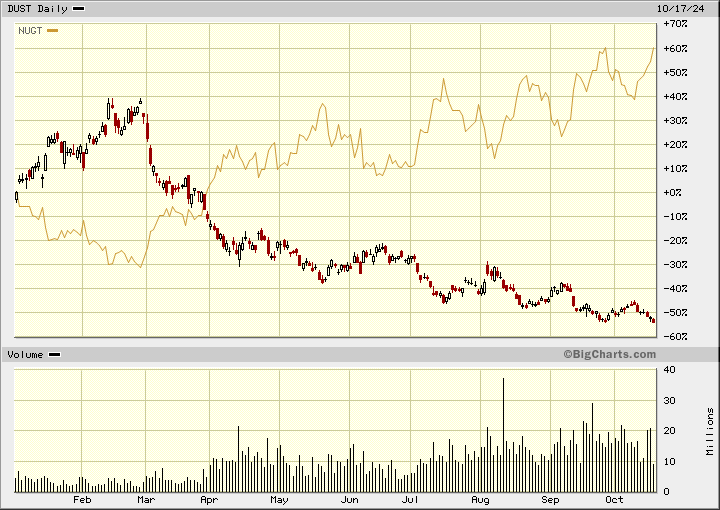
What is crazy is that volumes are increasing from August to September. These investors keep getting their heads handed to them in a basket and then go back for even more. At the same time, the volumes into the long etf NUGT are falling. I have never seen anything like this before, but it gives us a very good indicator to watch. When investors get tired of losing money, we should see the volumes drop off and then watch for volumes to increase in NUGT.
The junior explorers, as measured by the TSX Venture index, are still mired close to their bottom, but there are good signs of hope. The index is the highest it has been since May and should soon break those highs. I would like to see a close at 630 or higher as a firm breakout, and then a move above 660 would signal a major upside breakout. Also note the volumes are still low, not even up to the April/May levels.

Economic news was mixed but generally good. Consumers are keeping jobs and continue to spend, but manufacturing continues to be weak. Applications for U.S. unemployment benefits unexpectedly fell after jumping the previous week in Southeastern states affected by Hurricane Helene, and data will probably remain volatile in the coming weeks. Initial claims decreased by 19,000 to 241,000 in the week ended Oct. 12.
The median forecast in a Bloomberg survey of economists called for 259,000 applications. Continuing claims, a proxy for the number of people receiving benefits, increased to 1.87 million in the previous week to the highest since July, according to Labor Department data released Thursday.
The damage done by Helene and Hurricane Milton, which hit the Southeast two weeks later, has left many people unable to work and possibly unable to file for benefits. Retail sales rose 0.4% from August to September, up from 0.1% the previous month and the third straight increase. Online retailers, restaurants, and grocery stores all reported higher sales.
"Retail sales came in well above expectations and continue to defy the 'weak economy' thesis," said Quincy Krosby, chief global strategist for LPL Financial, a wealth management firm. The Federal Reserve Bank of Philadelphia said Thursday that its index for business activity rose to 10.3 in October from 1.7 in September. That was well beyond expectations for a rise to 3.0, according to economists surveyed by The Wall Street Journal ahead of the release.
The Philadelphia Fed survey polls manufacturers in the Third Federal Reserve District, which covers eastern Pennsylvania, southern New Jersey, and Delaware. Industrial production fell 0.3% in September, the Federal Reserve reported Thursday. The gain was below expectations of a 0.2% fall, according to a survey by The Wall Street Journal.
Capacity utilization slipped to 77.5% in September from 77.8% in the prior month. The capacity utilization rate reflects the limits to operating the nation's factories, mines, and utilities. Economists had forecast a 77.8% rate. The strike at Boeing Co. and the effects of two hurricanes subtracted an estimated 0.6% from production in September, the Fed said. For the third quarter as a whole, industrial production declined at a 0.6% annual rate.
U.S. home builder confidence rose in October for the second consecutive month but volatile mortgage rates and low housing affordability continued to pose headwinds. The NAHB/Wells Fargo Housing Market Index of builder confidence increased to 43 this month from 41 in September, the National Association of Home Builders said on Thursday. A Reuters poll showed economists expected the outlook to rise to 42 this month. The average 30-year fixed rate mortgage jumped to 6.32% last week, the biggest weekly gain since April, Freddie Mac data showed. The rate had declined to nearly 6% in late September from a high of almost 8% last October.
Data earlier this month showed that U.S. construction spending unexpectedly declined in August amid a sharp drop in outlays on single-family housing projects.
Zefiro Methane
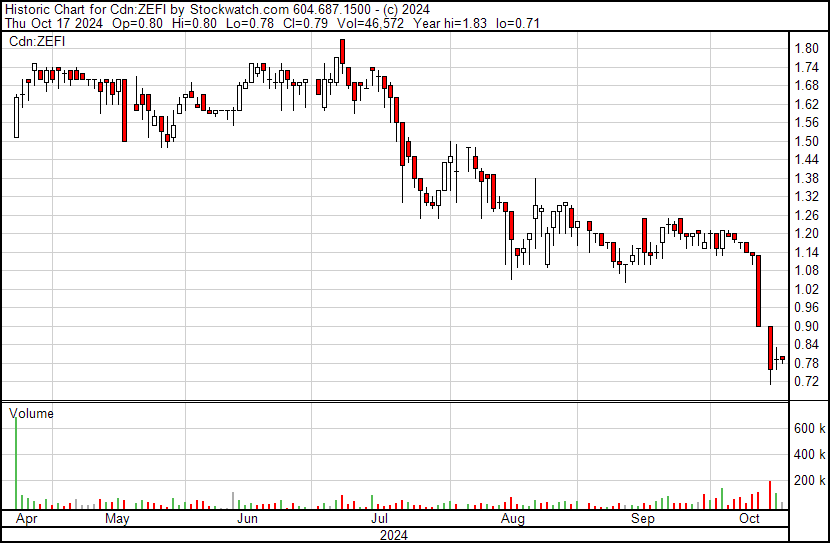
Recent Price – CA$0.79
Entry Price - CA$1.60
Opinion – Strong Buy, average down to CA$1.10
I did a video interview with the CEO of Zefiro Methane Corp. (ZEFI:CBOE; ZEFIF:OTC; Y6B:FRA) on Friday and loaded up on Youtube.
This is a very unique company and interview. A 50-cent financing becomes free trading around the last half of this month, and some of this selling has probably knocked the stock down in the last couple of days. So, the timing of this video to buy the stock is very good.
In the interview, the CEO said that their target was 5,000 well remedies per year. Zefiro had revenues of US$32.8 million for the last fiscal year. The current market cap is about US$55 million. The stock is cheap, trading at just 1.7 times revenue.
There are about 5 million orphaned wells in the U.S. Zefiro has a goal to get to a run rate of plugging 5,000 wells per year within five years. A good average on revenue for each well remedy is around an even US$100,000. Zefiro has the management to meet these goals and if they do it, that would amount to annual revenue of US$500 million. At this time the company would be way more advanced so a 5 to 10 times revenue multiple is likely.
Let's also assume there is about 60% share dilution to 150M shares:
- At five times revenue, the shares are US$16.66
- At 10 times revenue, the shares are US33.33
There is no telling how the road twists and turns and shares go up and down on the way, but this is a realistic potential within five years. I believe the stock is a great buy here, and it looks like it is trying to eke out a bottom around $0.80.
| Want to be the first to know about interesting Gold investment ideas? Sign up to receive the FREE Streetwise Reports' newsletter. | Subscribe |
Important Disclosures:
- Ron Struthers: I, or members of my immediate household or family, own securities of: GLD and Zefiro Methane. I determined which companies would be included in this article based on my research and understanding of the sector.
- Statements and opinions expressed are the opinions of the author and not of Streetwise Reports, Street Smart, or their officers. The author is wholly responsible for the accuracy of the statements. Streetwise Reports was not paid by the author to publish or syndicate this article. Streetwise Reports requires contributing authors to disclose any shareholdings in, or economic relationships with, companies that they write about. Any disclosures from the author can be found below. Streetwise Reports relies upon the authors to accurately provide this information and Streetwise Reports has no means of verifying its accuracy.
- This article does not constitute investment advice and is not a solicitation for any investment. Streetwise Reports does not render general or specific investment advice and the information on Streetwise Reports should not be considered a recommendation to buy or sell any security. Each reader is encouraged to consult with his or her personal financial adviser and perform their own comprehensive investment research. By opening this page, each reader accepts and agrees to Streetwise Reports' terms of use and full legal disclaimer. Streetwise Reports does not endorse or recommend the business, products, services or securities of any company.
For additional disclosures, please click here.
Struthers Resource Stock Report Disclosures
All forecasts and recommendations are based on opinion. Markets change direction with consensus beliefs, which may change at any time and without notice. The author/publisher of this publication has taken every precaution to provide the most accurate information possible. The information & data were obtained from sources believed to be reliable, but because the information & data source are beyond the author's control, no representation or guarantee is made that it is complete or accurate. The reader accepts information on the condition that errors or omissions shall not be made the basis for any claim, demand or cause for action. Because of the ever-changing nature of information & statistics the author/publisher strongly encourages the reader to communicate directly with the company and/or with their personal investment adviser to obtain up to date information. Past results are not necessarily indicative of future results. Any statements non-factual in nature constitute only current opinions, which are subject to change. The author/publisher may or may not have a position in the securities and/or options relating thereto, & may make purchases and/or sales of these securities relating thereto from time to time in the open market or otherwise. Neither the information, nor opinions expressed, shall be construed as a solicitation to buy or sell any stock, futures or options contract mentioned herein. The author/publisher of this letter is not a qualified financial adviser & is not acting as such in this publication.


