

The Dow Gold ratio is one of the most insightful tools for understanding the relationship between stock markets and gold, particularly in times of financial upheaval.
By comparing the price of the Dow Jones Industrial Average to the price of gold, this ratio helps investors gauge which asset, stock, or gold (which has historically been considered money) is outperforming the other.
Today, the ratio is calculated by dividing the Dow at ~42,000 by the gold price at ~ $2,600, equating to approximately 16.15 ounces of gold to buy one Dow share.
A high ratio indicates that stocks are expensive relative to gold, while a low ratio suggests that gold is more highly valued compared to stocks. Throughout history, this ratio has fluctuated dramatically, marking pivotal moments in the global financial landscape.
Key Moments in the Dow Gold Ratio
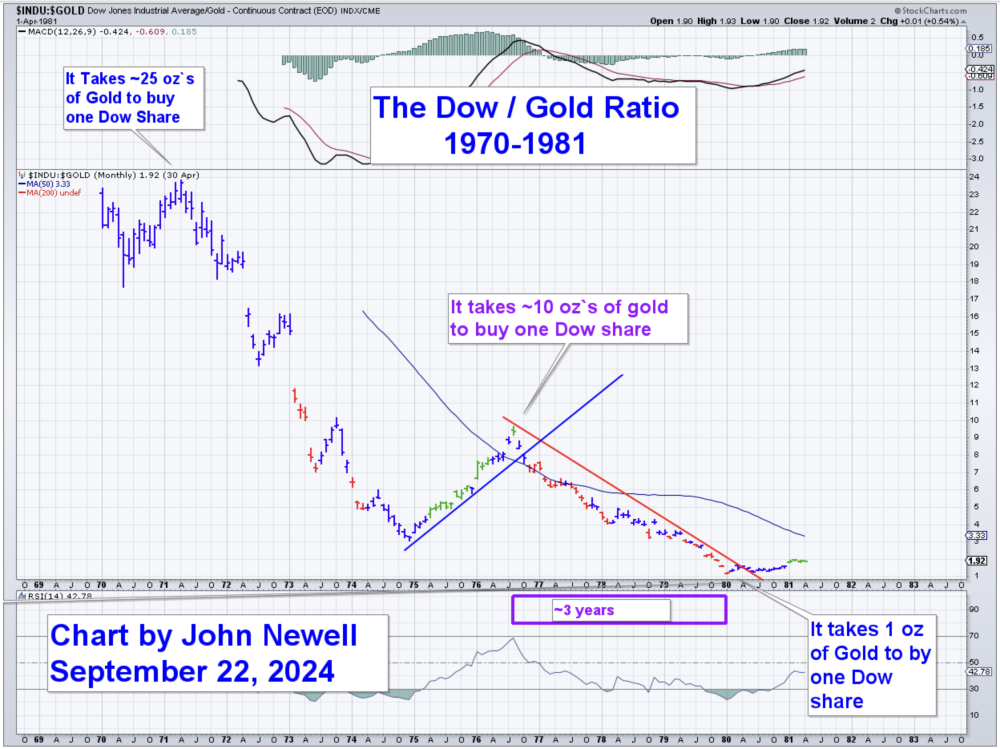
1971: 25:1
- At the beginning of 1971, it took roughly 25 ounces of gold to purchase a single share of the Dow. This was a period when stocks had outpaced the performance of gold for years, reflecting a broad belief in the strength of financial markets and economic growth. However, the U.S. was on the verge of significant changes in monetary policy.
1974: 3:1
- Just a few years later, by 1974, the ratio plummeted to 3 ounces of gold for each Dow share. The rapid devaluation of stocks relative to gold occurred as inflation surged and economic uncertainty took hold, particularly after the U.S. abandoned the gold standard in 1971. Investors flocked to gold as a hedge against inflation, causing gold's value to soar.
Late 1970s: 10:1
- Following this sharp decline, the Dow Gold ratio staged a partial recovery, rallying to 10:1 in the late 1970s. However, inflationary pressures and economic instability persisted, preventing a full recovery and keeping gold as a preferred asset for wealth preservation.
1980: 1:1
- By 1980, the ratio dropped to its lowest point in history — 1:1. This meant that one ounce of gold could buy one Dow share. This dramatic shift came at the peak of economic uncertainty, runaway inflation, and soaring interest rates. Gold had become the ultimate safe haven, while stocks were seen as highly volatile and risky.
2000: ~45:1
- The long bull market in stocks that began in the 1980s pushed the Dow Gold ratio to an astonishing 45:1 by the year 2000. This period was marked by technological innovation, economic growth, and low inflation, driving stocks to outperform gold significantly. Gold was out of favor, seen as a relic in a time of booming stock markets and rapid technological advancements.
2011: 6:1
- After the financial crisis of 2008, gold surged once again as investors sought safety amidst economic turmoil. By 2011, the ratio had corrected back to 6:1, reflecting a significant loss of confidence in the global financial system, while gold regained its stature as a store of value.
Today: ~16:1
- Currently, the Dow Gold ratio sits at approximately 16:1. The market has rebounded significantly since the lows of 2011, but we believe that these markets could be entering another period where gold starts to outpace stocks.
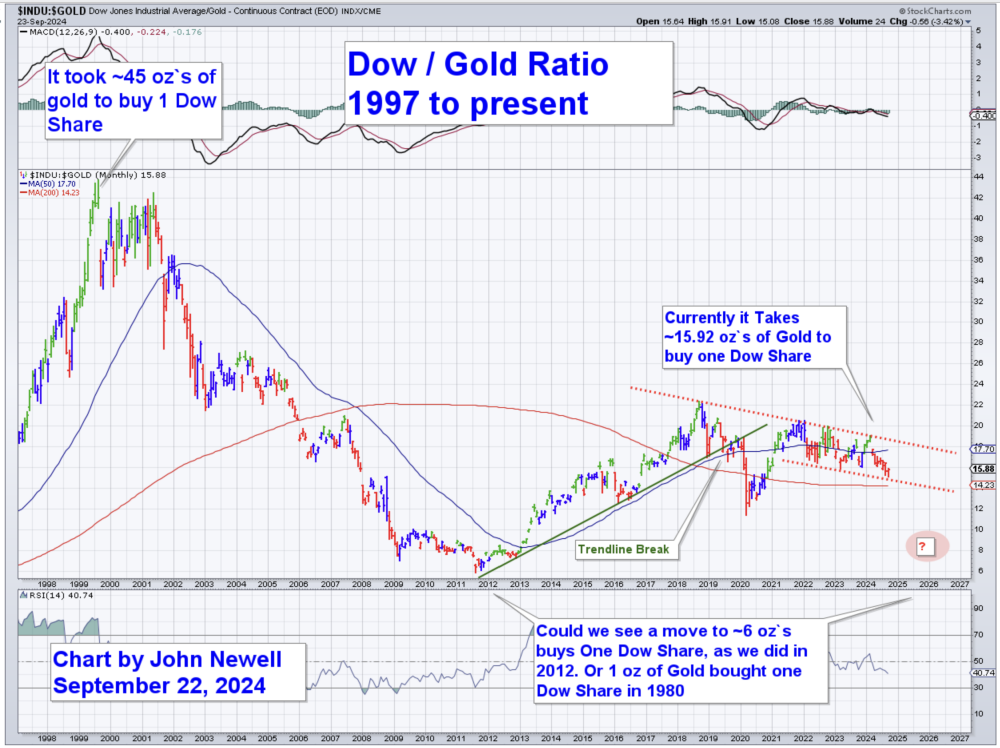
What's Next? Could We See a Return to 6:1 or Even 1:1?
As the saying goes, "History doesn't repeat, but it often rhymes."
Looking at past cycles, it's clear that the Dow Gold ratio tends to revert toward certain key levels during times of economic stress and uncertainty. If "past is prologue," the charts suggest that we may be heading back toward a 6:1 ratio and possibly even another ~ 1:1 scenario, as we saw in 1933 and 1980
Several factors support this thesis:
- Global Inflation and Monetary Policy: Inflation is again a significant concern for investors, with central banks worldwide continuing to grapple with rising prices. Historically, periods of high inflation have favored gold over stocks as investors seek to preserve their purchasing power.
- Geopolitical Instability: The ongoing geopolitical tensions, trade wars, and economic uncertainty are causing shifts in global financial markets. Gold traditionally performs well in these environments, as it is seen as a safe-haven asset.
- Debasement of Fiat Currencies: With massive debt levels and aggressive monetary stimulus measures, fiat currencies are losing value relative to hard assets like gold. As more central banks move toward looser monetary policies, gold's relative strength is likely to increase, pushing the Dow Gold ratio lower.
- Investor Sentiment: While stocks have performed well over the last decade, there are growing concerns about valuations, especially in tech-heavy indices like the Dow. A correction or a prolonged period of stagnation in stock markets could further tilt the ratio in gold's favor.
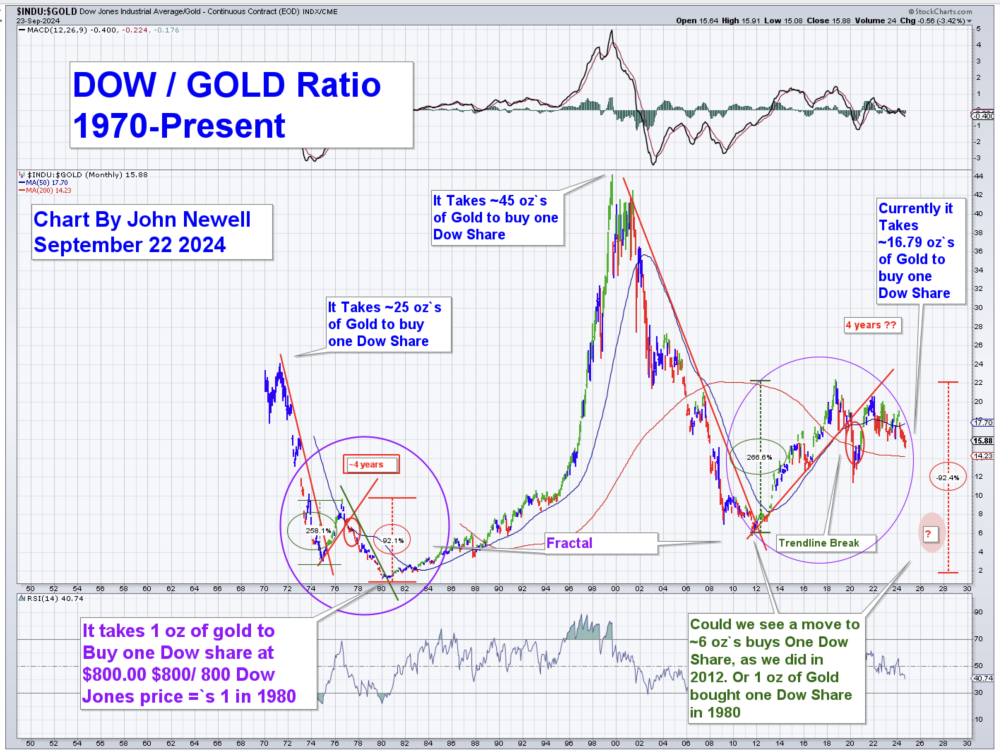
The Big Picture Dow / Gold Ratio Chart
Conclusion: The Dow Gold Ratio and the Case for Gold
The Dow Gold ratio has been a reliable barometer of market sentiment and economic conditions for decades. It tells a story of booms, busts, and the cyclical nature of markets.
If history is any indication, we may be on the cusp of another significant move in favor of gold. The current ratio of 16:1 is far from the extremes we've seen in the past, and we believe that a return to 6:1 is possible in the near future.
In more extreme cases, we could even see a return to the historic 1:1 ratio, as the chart shows is possible, because it happened before in 1933 and 1980.
For investors seeking protection against economic uncertainty and inflation, the Dow Gold ratio offers a compelling case for gold as a valuable part of any diversified portfolio.
| Want to be the first to know about interesting Gold investment ideas? Sign up to receive the FREE Streetwise Reports' newsletter. | Subscribe |
Important Disclosures:
-
Statements and opinions expressed are the opinions of the author and not of Streetwise Reports, Street Smart, or their officers. The author is wholly responsible for the accuracy of the statements. Streetwise Reports was not paid by the author to publish or syndicate this article. Streetwise Reports requires contributing authors to disclose any shareholdings in, or economic relationships with, companies that they write about. Any disclosures from the author can be found below. Streetwise Reports relies upon the authors to accurately provide this information and Streetwise Reports has no means of verifying its accuracy.
- This article does not constitute investment advice and is not a solicitation for any investment. Streetwise Reports does not render general or specific investment advice and the information on Streetwise Reports should not be considered a recommendation to buy or sell any security. Each reader is encouraged to consult with his or her personal financial adviser and perform their own comprehensive investment research. By opening this page, each reader accepts and agrees to Streetwise Reports' terms of use and full legal disclaimer. Streetwise Reports does not endorse or recommend the business, products, services or securities of any company.
For additional disclosures, please click here.
John Newell Disclaimer
As always it is important to note that investing in precious metals like silver carries risks, and market conditions can change violently with shock and awe tactics, that we have seen over the past 20 years. Before making any investment decisions, it's advisable consult with a financial advisor if needed. Also the practice of conducting thorough research and to consider your investment goals and risk tolerance.


