Apart from some wild tradable gyrations that were more in its distant past, this looks like the best time ever to buy Brixton Metals Corporation (BBB:TSX.V) for two big reasons. One is that, after trading at ever lower levels for many years, it at last looks ready to embark on a major bull market. The other is that, with a major financial crisis on the horizon a torrent of funds is destined to make its way from paper assets into tangibles, primarily gold and silver but also the other more industrial metals.
Before proceeding to review the latest stock charts for the company we will overview its fundamentals using the latest Investor Deck which was produced just this month and so is up to date.
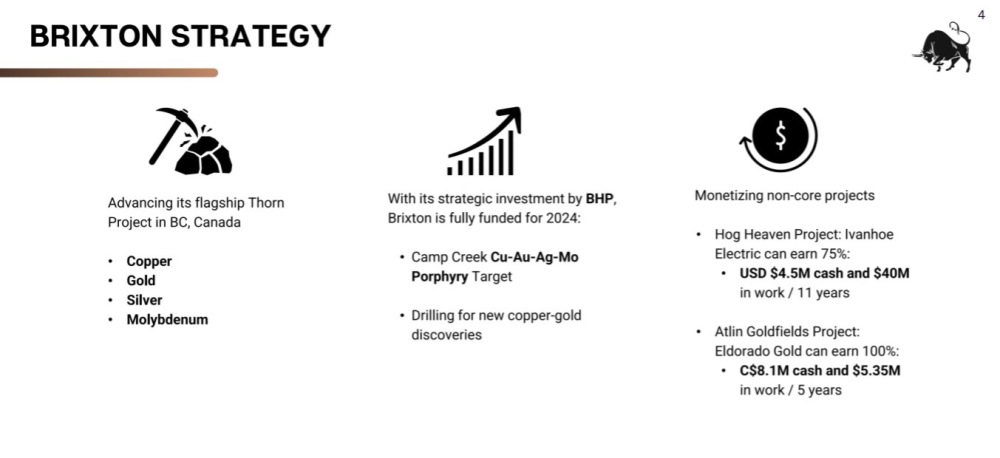
The first slide from the Deck shows us Brixton's strategy which involves advancing its flagship Thorn property in northern British Columbia that contains copper, gold, molybdenum, and silver; drilling for new copper-gold discoveries; and monetizing non-core projects. Importantly, it reveals that BHP has a sizable stake in the company, which is certainly a vote of confidence and we will see just how big its stake is later.
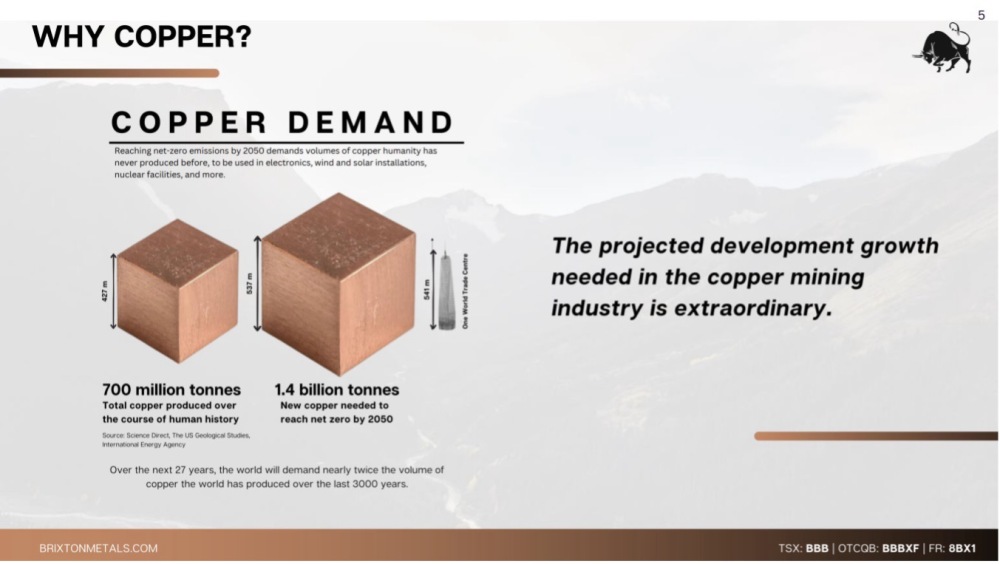
This next interesting slide shows us in a dramatic manner the projected increase in demand for copper that will doubtless have a positive impact on the copper price…
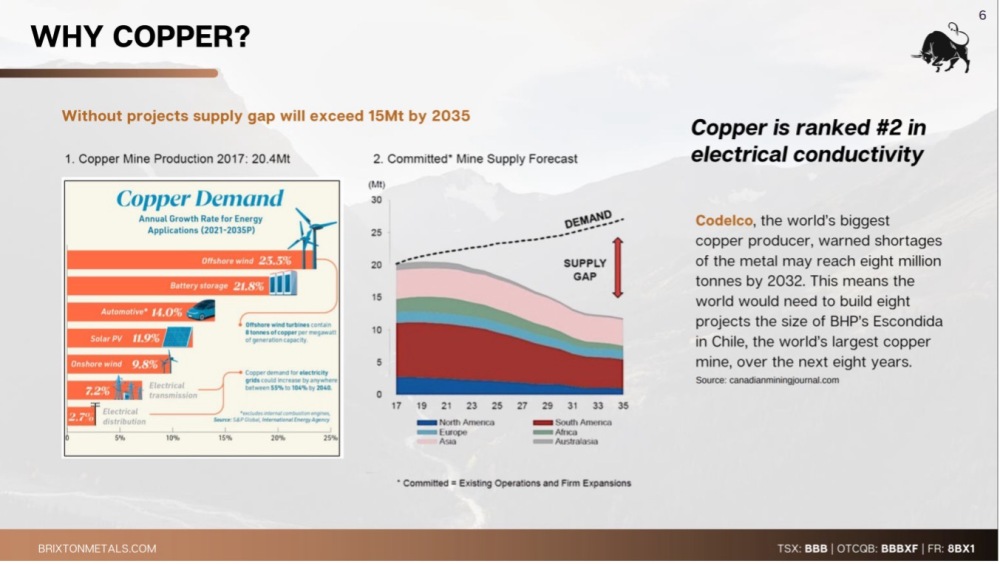
The following slide highlights the yawning copper supply gap bearing down on the market that has already begun and is set to drive copper prices much higher and is thus destined to reward copper producers and explorers working to develop worthwhile projects such as Brixton…
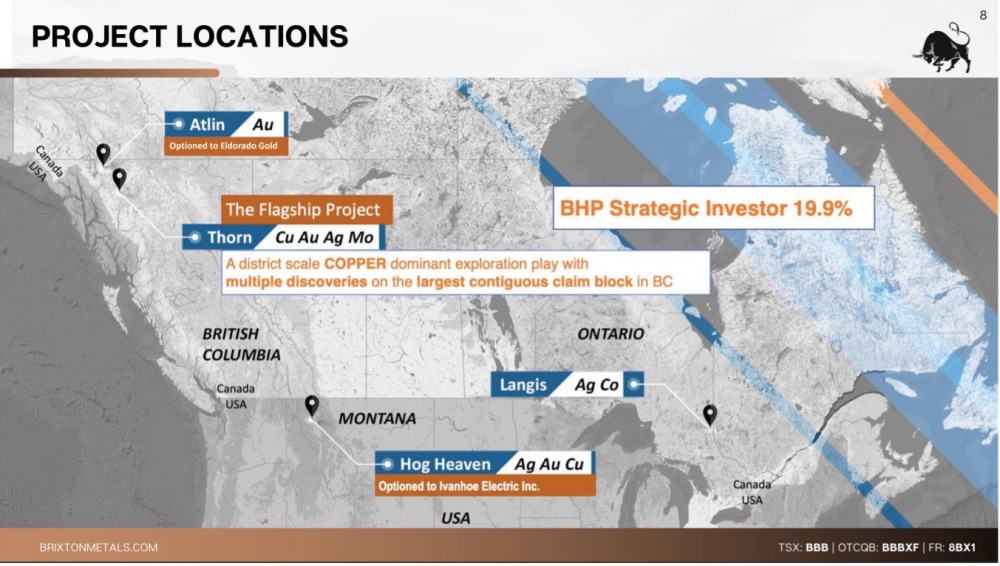
On the next slide we see that the company has a range of projects, mostly in Canada but extending down into Montana. The monetization of the lesser properties can be used to provide the liquidity to drive forward the copper dominant flagship Thorn Project which is District Scale and the largest contiguous claim block in British Columbia…
The flagship Thorn Project in the Golden Triangle is not only big but in good company with many "heavy hitting" companies in the area, including Newmont Corp. (NEM:NYSE), Seabridge Gold Inc. (SEA:TSX; SA:NYSE.MKT), and Teck Resources Ltd. (TECK:TSX; TECK:NYSE)….

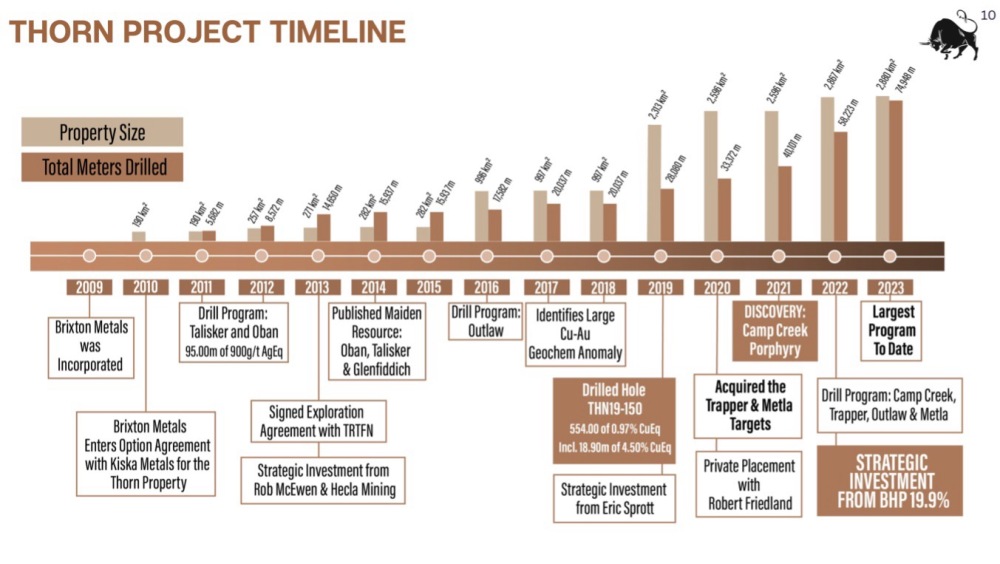
The next slide shows the Thorn Project timeline and how it is steadily moving forward and where BHP weighed in in 2022 taking a sizable stake of almost 20%...
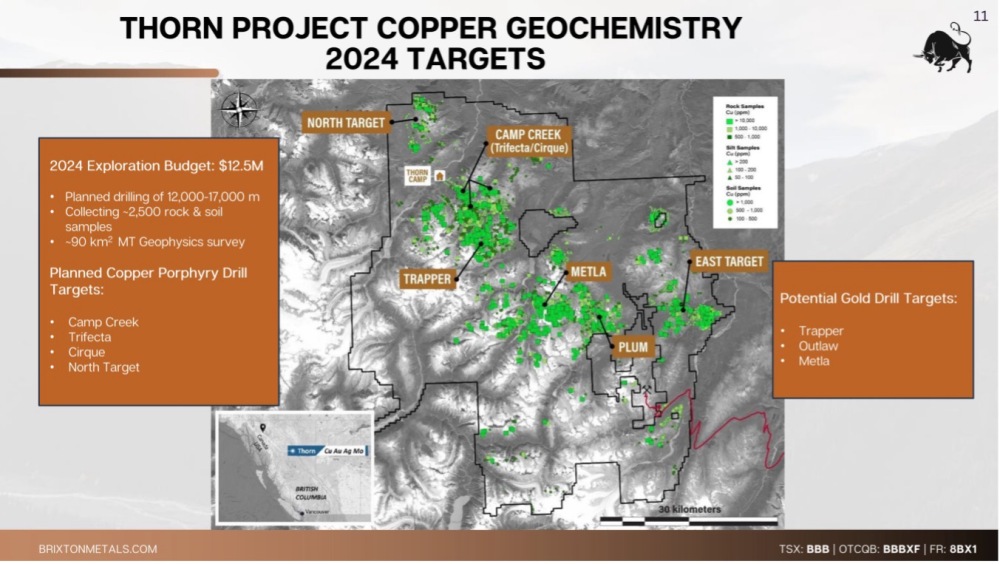
Here are the 2024 targets at Thorn…
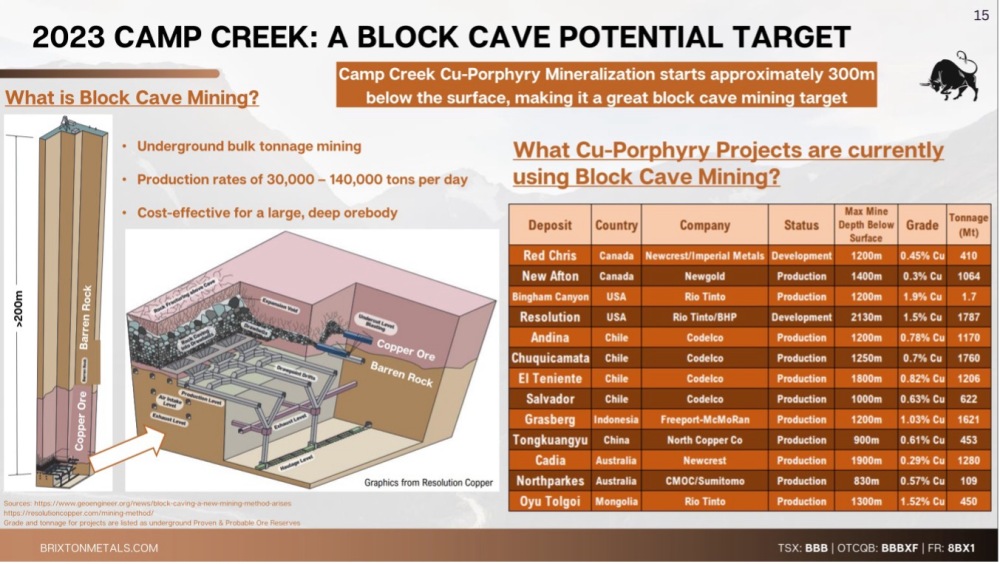
The Block Cave Mining technique may be employed at Camp Creek at Thorn…
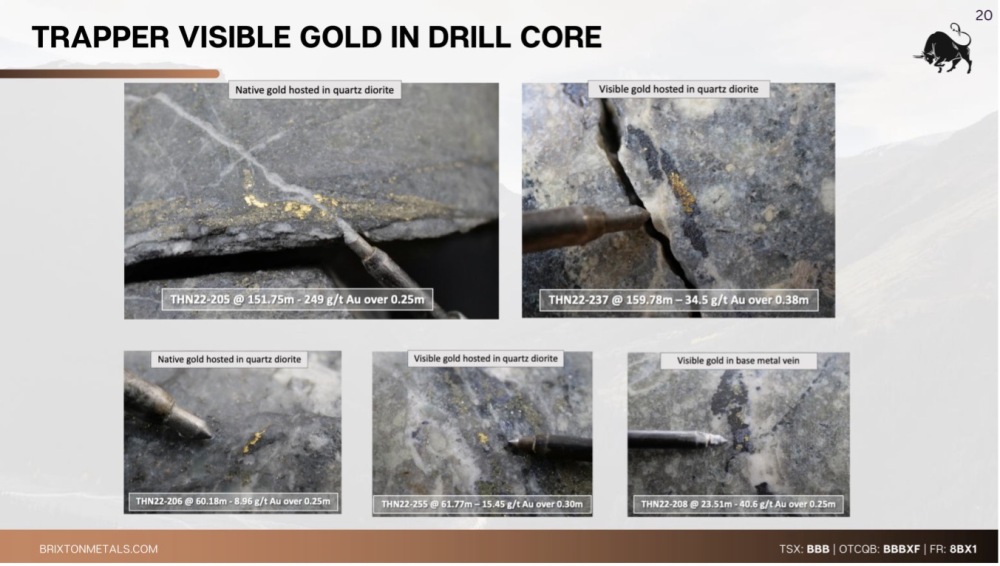
Visible gold at the Trapper target, where the company drilled near-surface holes with assays like 64 meters of 5.7 g/t Au in hole 205...
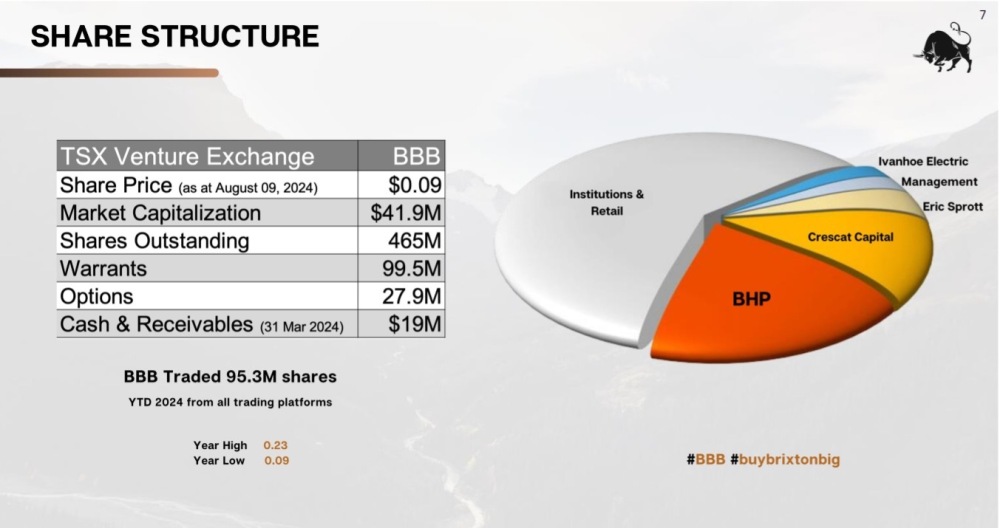
This last slide shows us that, although the number of shares in issue is sizable at 465 million, this is of course largely factored into the stock price, and in any case, of these, almost 20% are held by BHP with a further large slice owned by Crescat Capital and a significant percentage owned by Ivanhoe Electric, institutions and high net worth investors like Eric Sprott…
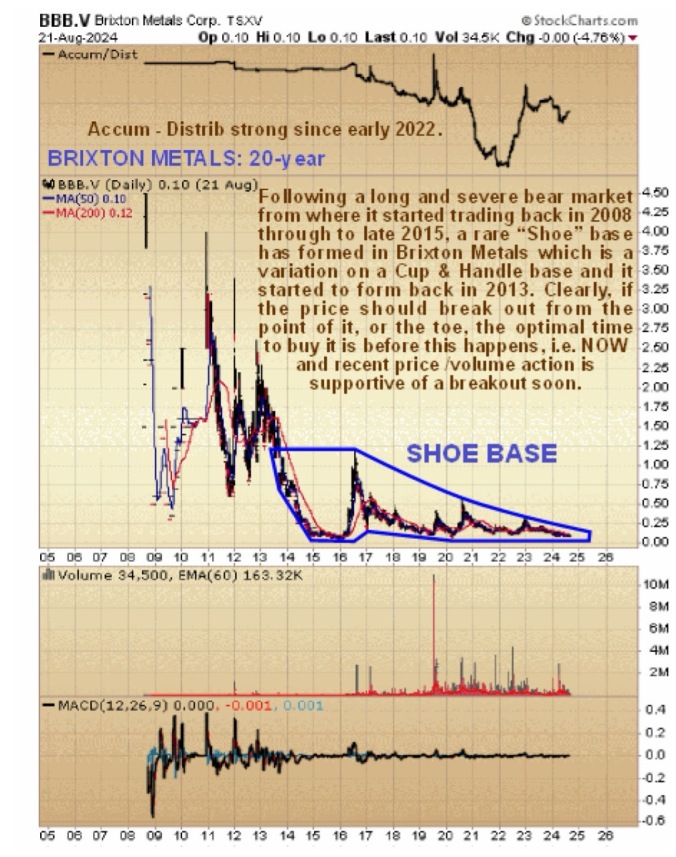
Turning now to the stock charts for Brixton Metals we see on its long-term 20-year chart that, apart from some wild tradable swings during its early years, it has essentially been in a long bear market for all of its life, although that said it has been in a protracted basing process since late 2015 when the price hit bottom at about the same level that it is at now. The pattern that has formed since as far back as mid-2013 is a rare "Shoe" base, which is a variation on a "Cup & Handle" base where a relatively short duration "Cup," which in this case formed over a three-year period from mid-2013 to mid-2016, is followed by a very elongated long-lasting Handle that has continued right up to the present. With the price trading in an ever-narrowing range into the point or "toe" of the Shoe there are possible scenarios — one is the company goes bust and the stock is delisted, which the fundamentals of Brixton indicate is not going to happen especially as it is monetizi ng its non-core assets, or it breaks out of the base into a new bull market, which given how long the stock has been trading in a relatively narrow range is likely to involve it making a large percentage gain quickly. Before leaving this chart, note the strong performance of the Accumulation line over the past two years which certainly augurs well.
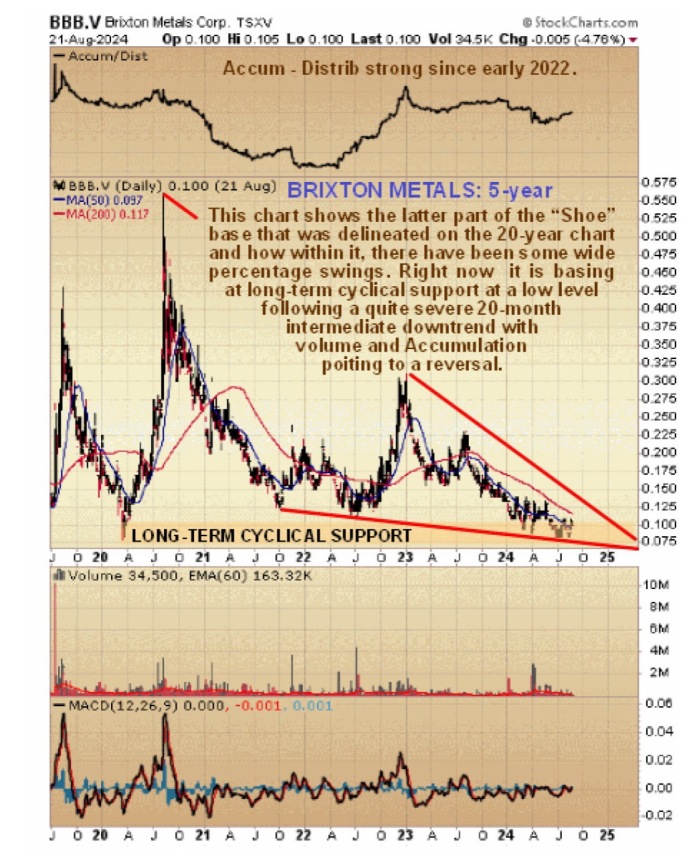
Moving on, the five-year chart enables us to examine the latter part of the Shoe base in more detail. Here we see that even though the price fluctuations during this period don’t look all that great on the 20-year chart, they actually involved some big percentage swings. Following a quite severe 20-month downtrend, the stock looks like it is basing here at a very low level at long-term cyclical support that can be traced back to the 2020 lows and further back than that, as we saw on the last chart, to the 2015 – 2015 lows.
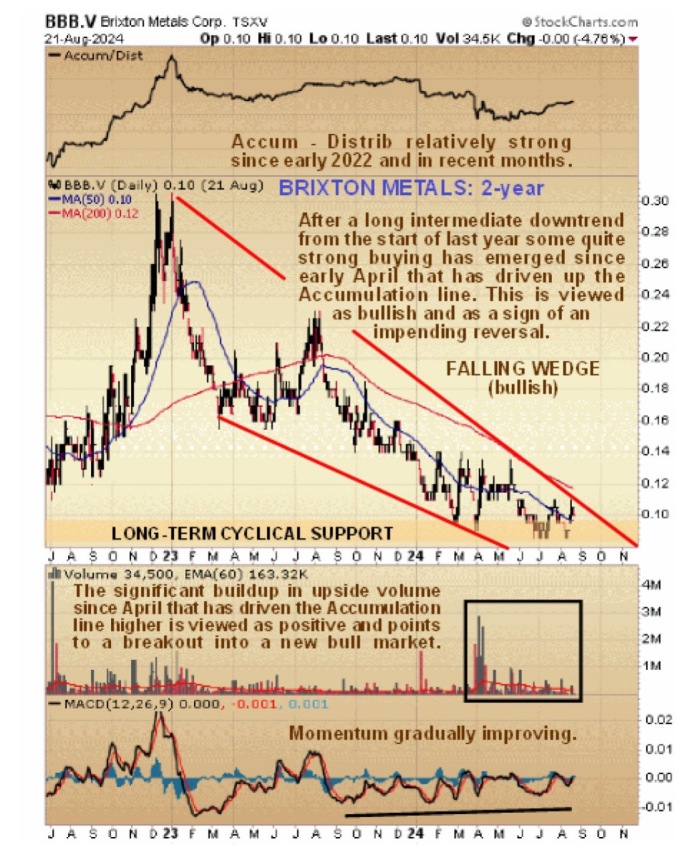
Zooming in again via a two-year chart we see that the downtrend from the start of last year has taken the form of a bullish Falling Wedge, with marked technical improvement since April as we have seen persistent upside volume appear that has driven the Accumulation line higher, as momentum (MACD) has gradually improved. These developments augur well for a reversal to the upside soon, especially as a sector bull market is getting underway.
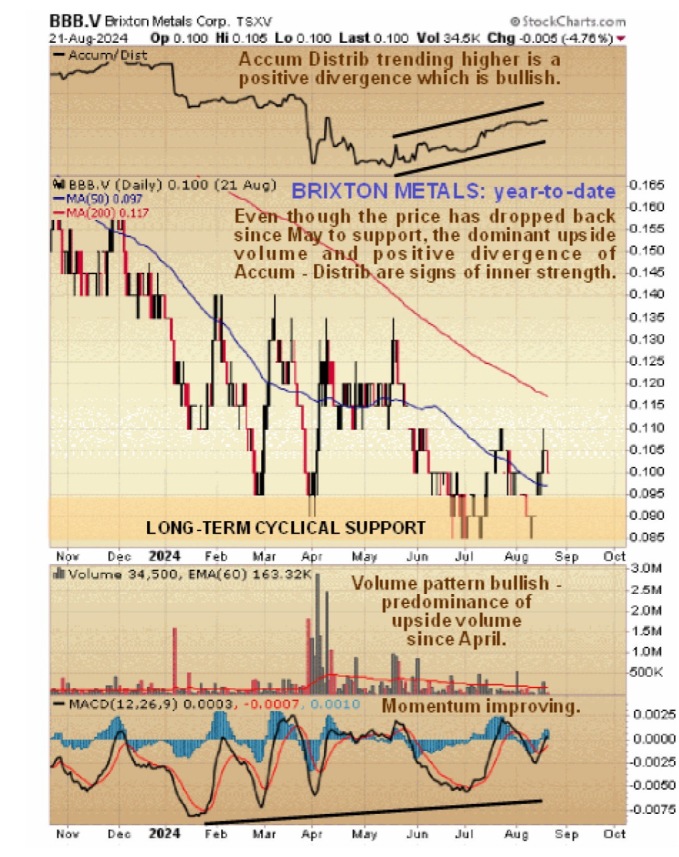
Lastly, the year-to-date chart enables us to view recent action in detail and on it we see that, even though the price has dropped back since May to the long-term support, forced lower by the still bearishly aligned moving averages, upside volume has continued relatively strong driving an uptrend in the Accumulation line that portends a reversal to the upside — a breakout into a new bull market and the marked shift in sentiment that such a breakout will engender should drive a strong initial rally.
The conclusion is that this is the optimal time to buy Brixton Metals which is rated a Strong Buy here.
Brixton Metals website.
Brixton Metals Corp, BBB.V, C$0.105, BBBXF on OTC, $0.076 at close on August 22, 2024.
| Want to be the first to know about interesting Base Metals, Critical Metals, Silver and Gold investment ideas? Sign up to receive the FREE Streetwise Reports' newsletter. | Subscribe |
Important Disclosures:
- For this article, the Company has paid Street Smart, an affiliate of Streetwise Reports, US$2,500.
- Author Certification and Compensation: [Clive Maund of clivemaund.com] was retained and compensated as an independent contractor by Street Smart to write this article. Mr. Maund is a technical analyst who analyzes historical trading data and he received his UK Technical Analysts' Diploma in 1989. The recommendations and opinions expressed in this content reflect the personal, independent, and objective views of the author regarding any and all of the companies discussed. No part of the compensation received by the author was, is, or will be directly or indirectly tied to the specific recommendations or views expressed.
- Statements and opinions expressed are the opinions of the author and not of Streetwise Reports, Street Smart, or their officers. The author is wholly responsible for the accuracy of the statements. Streetwise Reports was not paid by the author to publish or syndicate this article. Streetwise Reports requires contributing authors to disclose any shareholdings in, or economic relationships with, companies that they write about. Any disclosures from the author can be found below. Streetwise Reports relies upon the authors to accurately provide this information and Streetwise Reports has no means of verifying its accuracy.
- This article does not constitute investment advice and is not a solicitation for any investment. Streetwise Reports does not render general or specific investment advice and the information on Streetwise Reports should not be considered a recommendation to buy or sell any security. Each reader is encouraged to consult with his or her personal financial adviser and perform their own comprehensive investment research. By opening this page, each reader accepts and agrees to Streetwise Reports' terms of use and full legal disclaimer. Streetwise Reports does not endorse or recommend the business, products, services or securities of any company.
For additional disclosures, please click here.
Clivemaund.com Disclosures
The above represents the opinion and analysis of Mr. Maund, based on data available to him, at the time of writing. Mr. Maund's opinions are his own, and are not a recommendation or an offer to buy or sell securities. As trading and investing in any financial markets may involve serious risk of loss, Mr. Maund recommends that you consult with a qualified investment advisor, one licensed by appropriate regulatory agencies in your legal jurisdiction, and do your own due diligence and research when making any kind of a transaction with financial ramifications. Although a qualified and experienced stock market analyst, Clive Maund is not a Registered Securities Advisor. Therefore Mr. Maund's opinions on the market and stocks cannot be construed as a recommendation or solicitation to buy and sell securities.


