Aztec Minerals Corp. (AZT:TSX.V; AZZTF:OTCQB) is primarily an established gold-silver exploration company that is positioned to make a potentially big discovery or discoveries in mining-friendly areas in Arizona and NW Mexico with a view to greatly increasing its value which will likely result in it being bought out at a premium by a major mining company.
The reason that it is of interest to us as investors and speculators is that its shares are currently trading at relatively low prices at a time when the entire mining sector is at the point of embarking on a major bull market for a variety of reasons likely to be of unprecedented proportions.
Before examining the latest stock charts for Aztec, we will overview the fundamentals of the company using a range of slides lifted from its latest investor deck, but note that we will not be looking at those detailing the geology of the company's properties for reasons of space and because we don't need to go into this kind of detail. Those of you who have knowledge of geology and are interested can, of course, find this information in the deck linked above.
So, we'll start with an overview of the company.
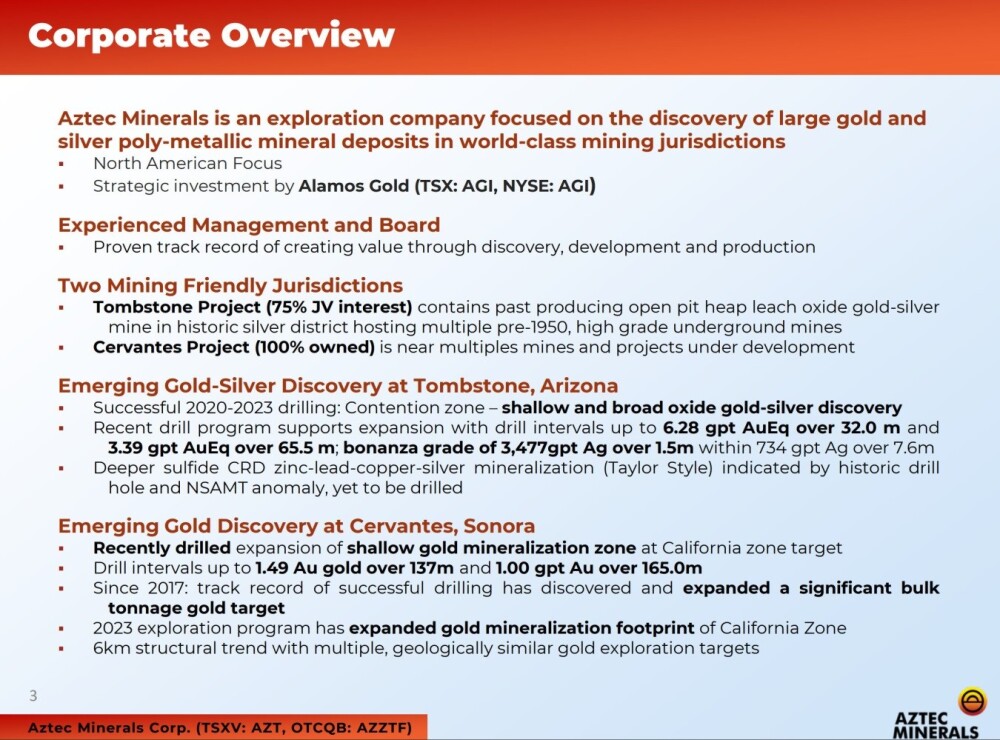
This slide from the deck makes the case for buying the stock on one page, provided that this is confirmed by what we are seeing on the stock charts, and it is.
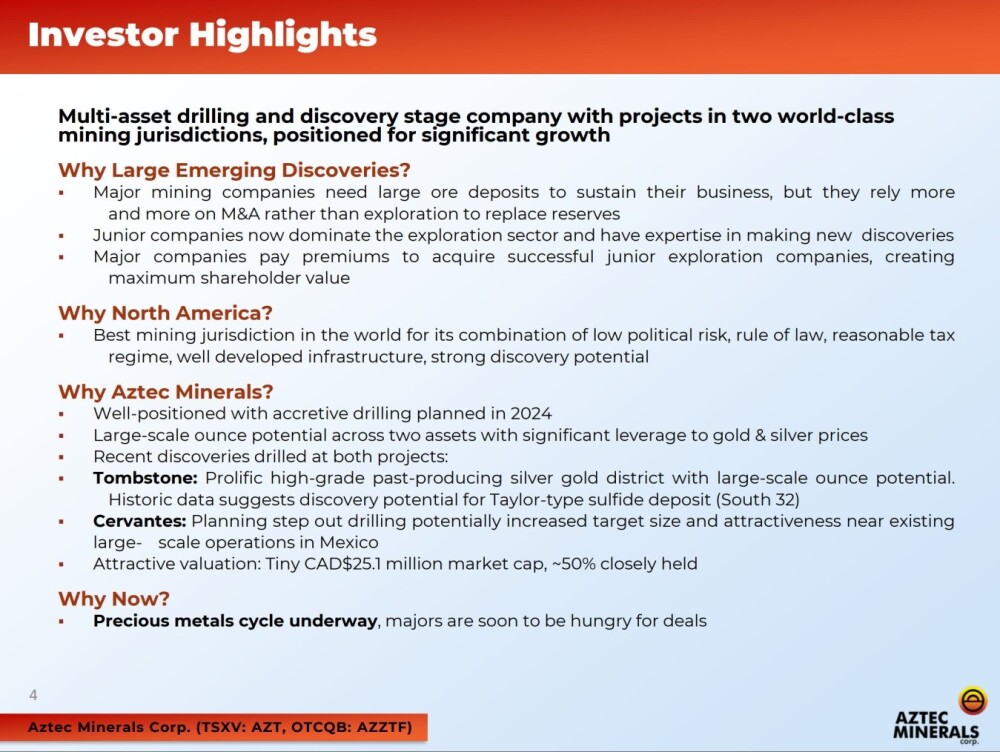
The next slide shows the locations of the company's two big properties, one just north of the border near Tombstone, Arizona, and the other not too far away in NW Mexico.
The Tombstone property is primarily gold and silver, and the Cervantes property is mainly gold.
Now, we'll briefly overview these two big properties, starting with Tombstone.
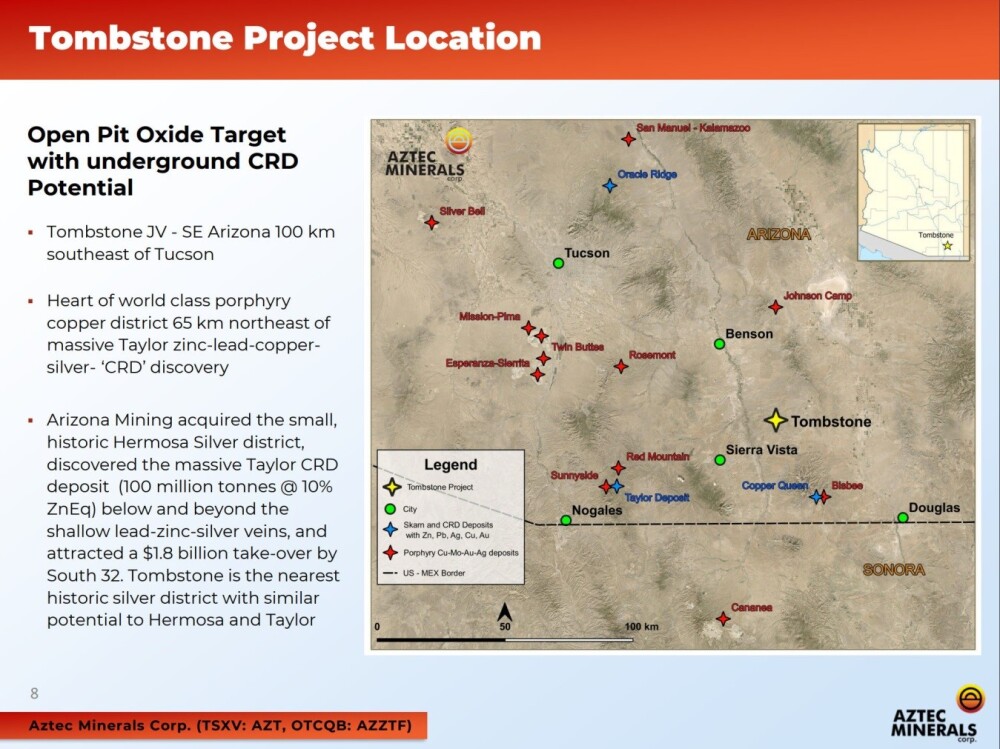
The map on the following slide shows Tombstone's location relative to other deposits in the area, some of which are BIG, like the Taylor deposit found by Arizona Mining, which was subsequently gobbled up by South32, resulting in massive windfall gains for investors in the company, and Tombstone has similar potential.
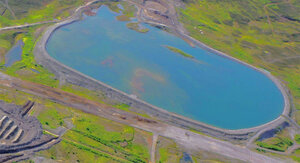
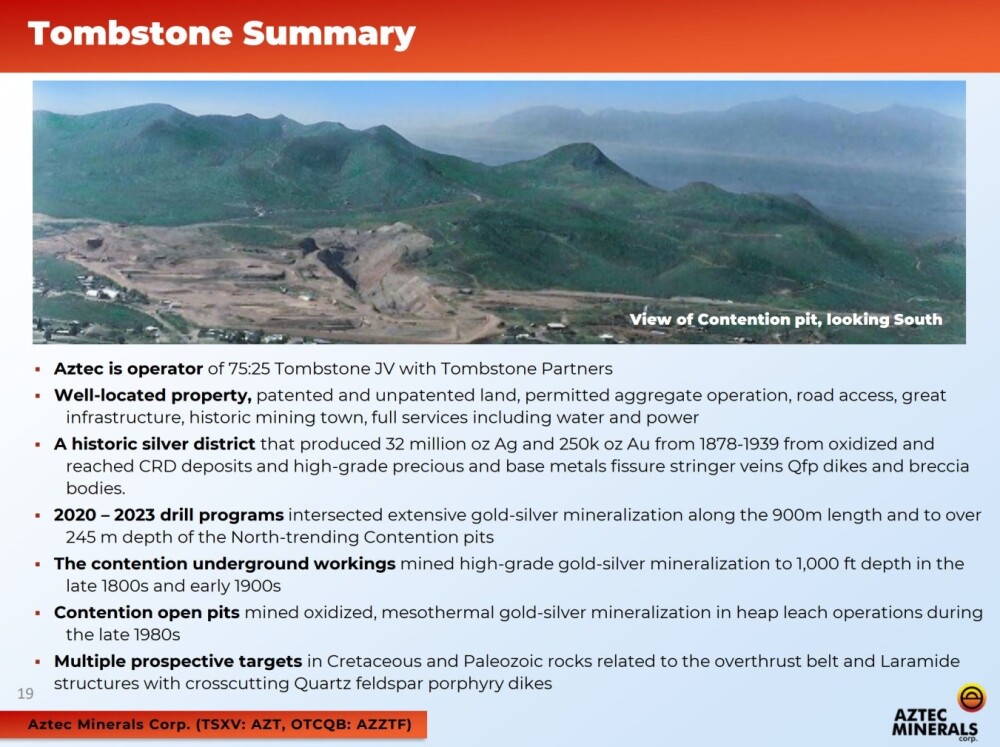
The following slide lists the attributes of the Tombstone property, in which the company has a 75% joint venture interest, and it shows a photo of the oval-shaped Contention Pit.
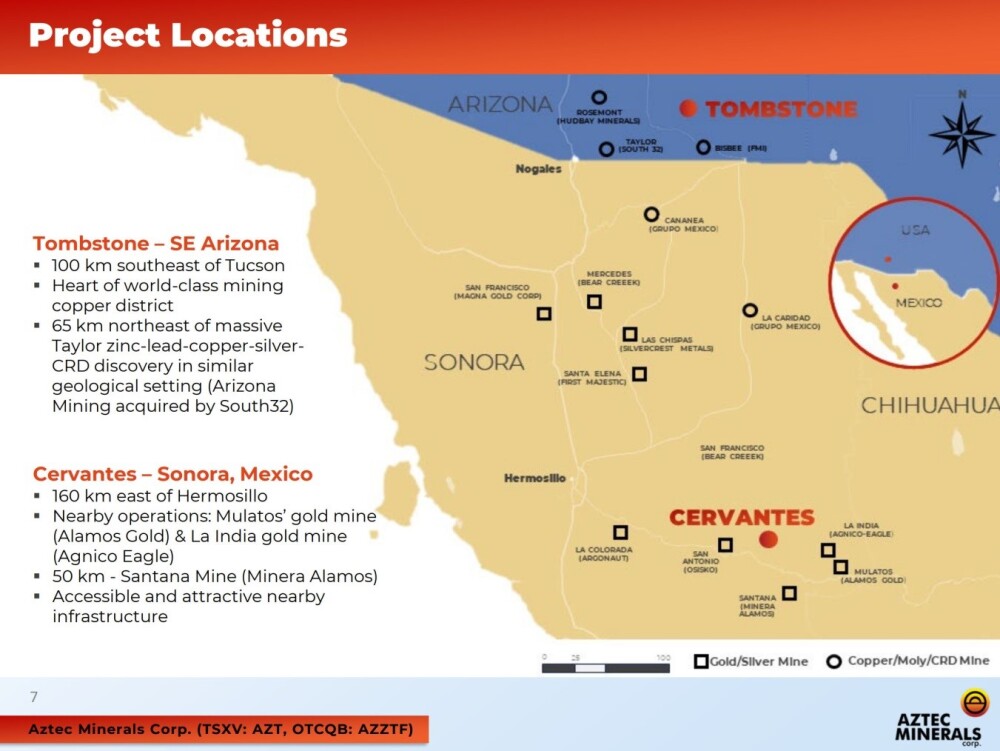
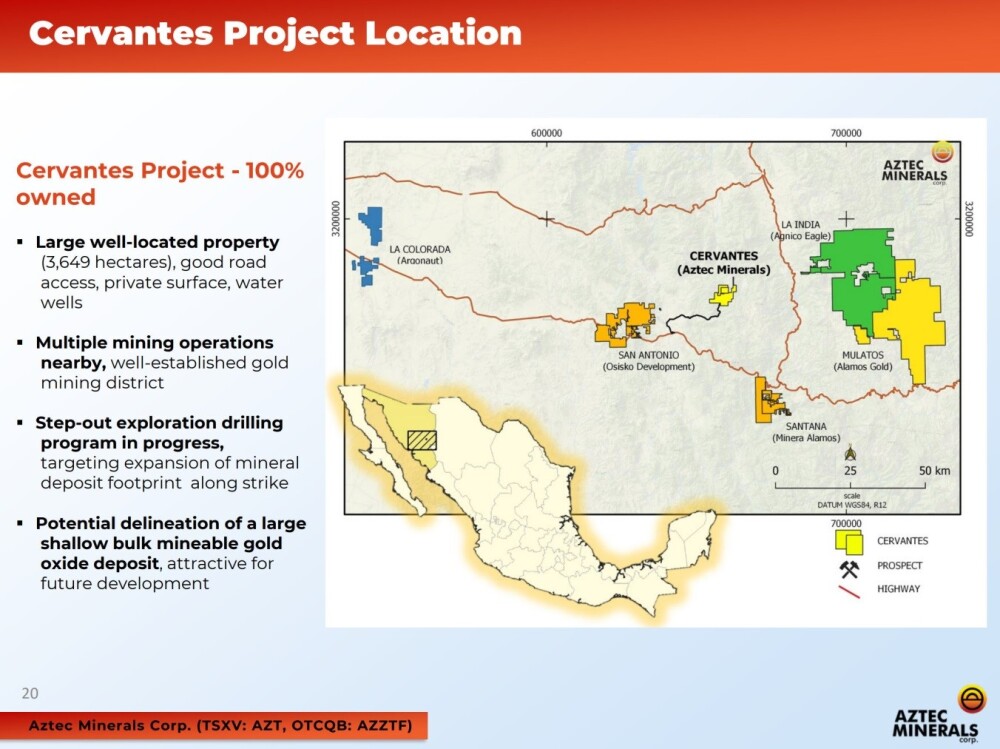
The location and environs of the other big property, the Cervantes property in NW Mexico, is shown on this slide, and it is interesting to see that there are other big and mid-cap companies operating nearby, such as Agnico-Eagle, Alamos Gold, Minera Alamos, and Osisko, and they wouldn't be in the area without good reason.
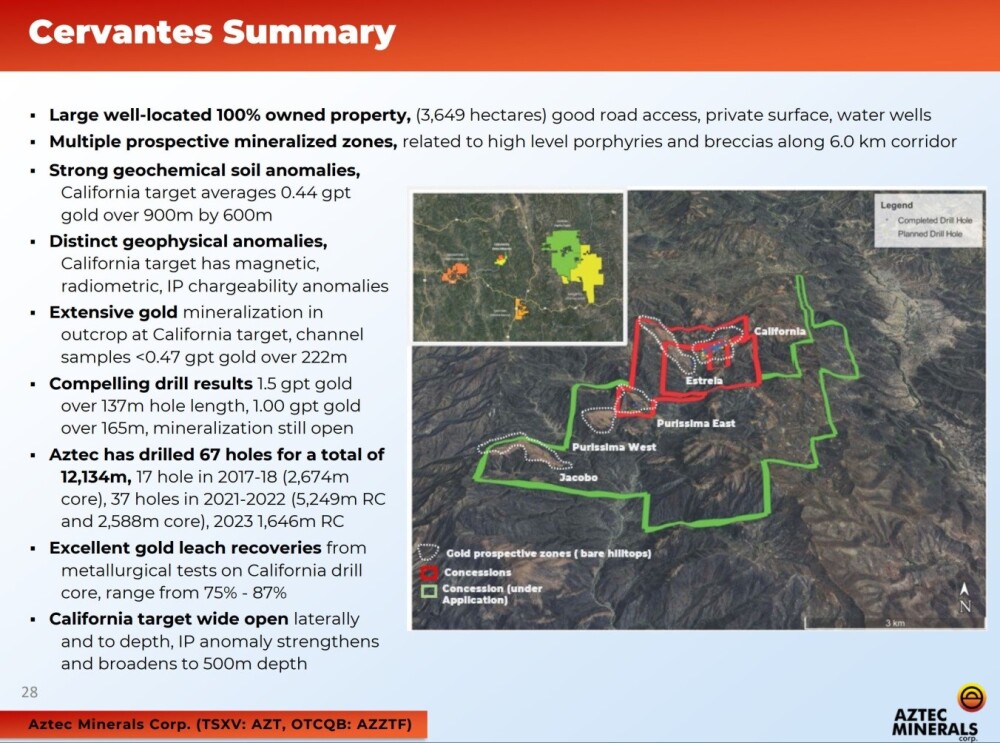
The following slide lists the attributes of the Cervantes property.
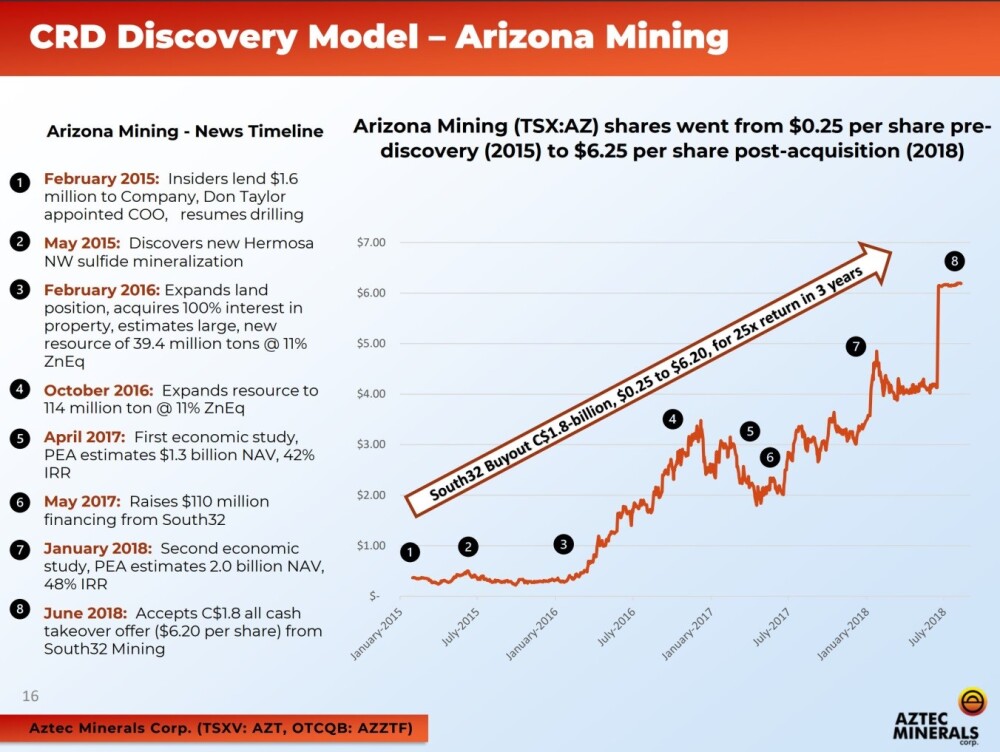
The company makes no secret of the fact that it will become a takeover target if it makes a sizeable discovery as looks likely and gives the example of what happened to the stock price of Arizona Mining after it discovered the massive Taylor deposit and was then bought out by South32.
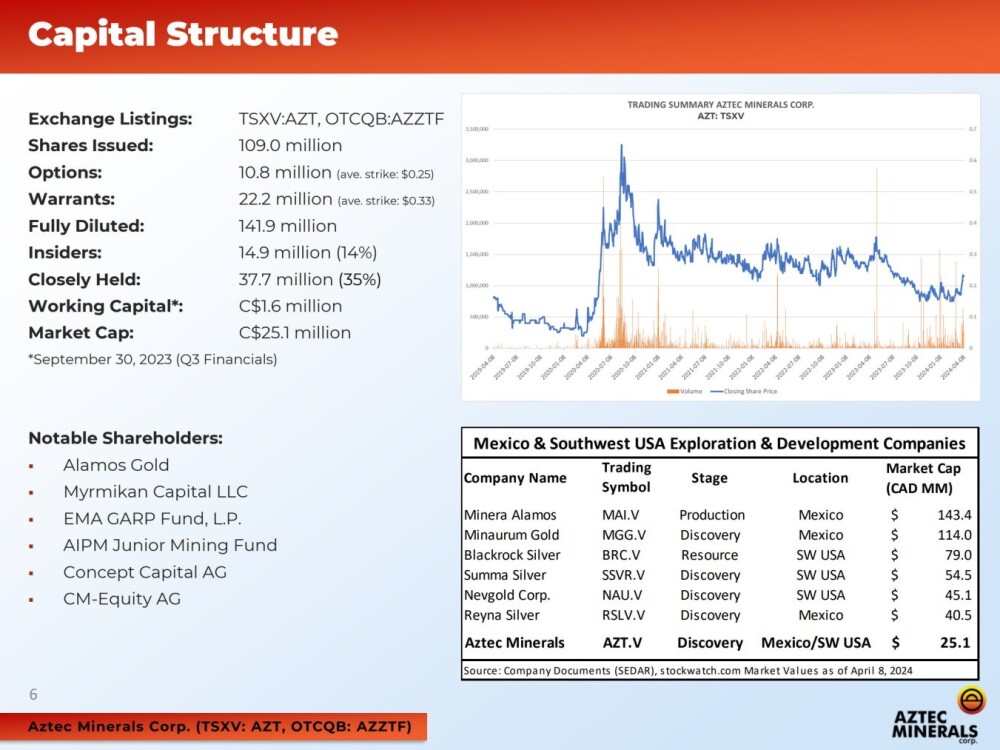
The last slide shows the capital structure, and it is of note that of the 109 million shares in issue, insiders own 14%, with 35% being closely held, and Alamos Gold is a strategic investor.
Now, we will examine the latest stock charts for Aztec Minerals to see what they have to say about its prospects.
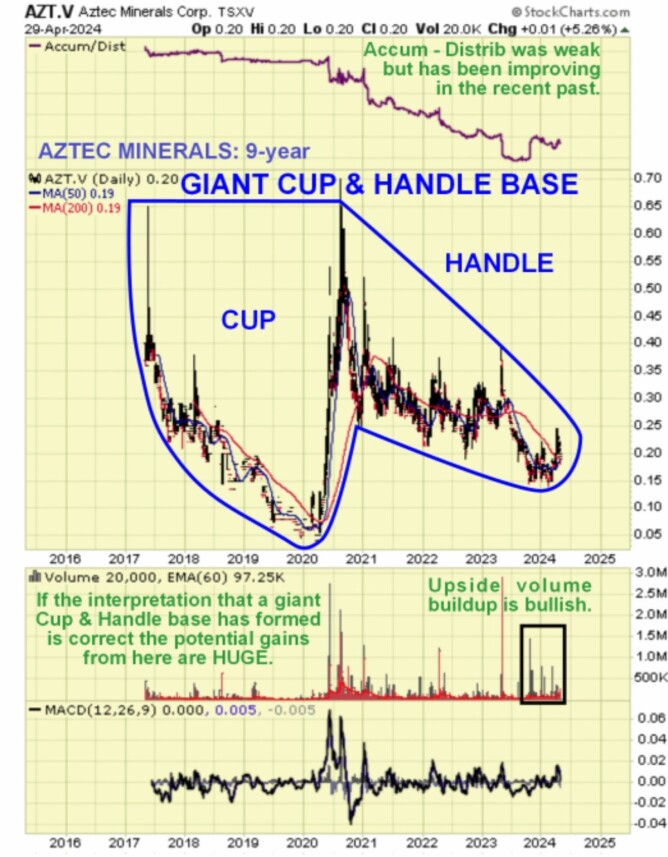
We will start by looking at the long-term 9-year chart in order to gain a "big picture" perspective of the history of the stock and what it implies for the future. On this chart, we can see that the stock has been in a persistent bear market since mid-2020 for almost four years now; however, for various reasons, this bear market is thought to have run its course, with the final low being put in in February.
One big reason is that all of the action from the mid-2020 spike high is thought to constitute the Handle of the giant Cup and Handle base depicted on the chart. This is a very important observation because, if true, it implies that the stock will, in due course, blast right out of the top of this pattern, and that is a perfectly reasonable expectation given that gold, silver, and copper are beginning what should prove to be their greatest bull markets of all time — and here we should note that the price of the stock will triple from the current position even before it breaks out of the top of the Cup and Handle base.
Before leaving this chart, it is worth observing the upside volume buildup in recent months that has caused the Accumulation line to take a turn for the better — this is a sign that the giant base pattern is complete and that a new bull market is about to start, which makes sense given that the great metals bull market has now begun.
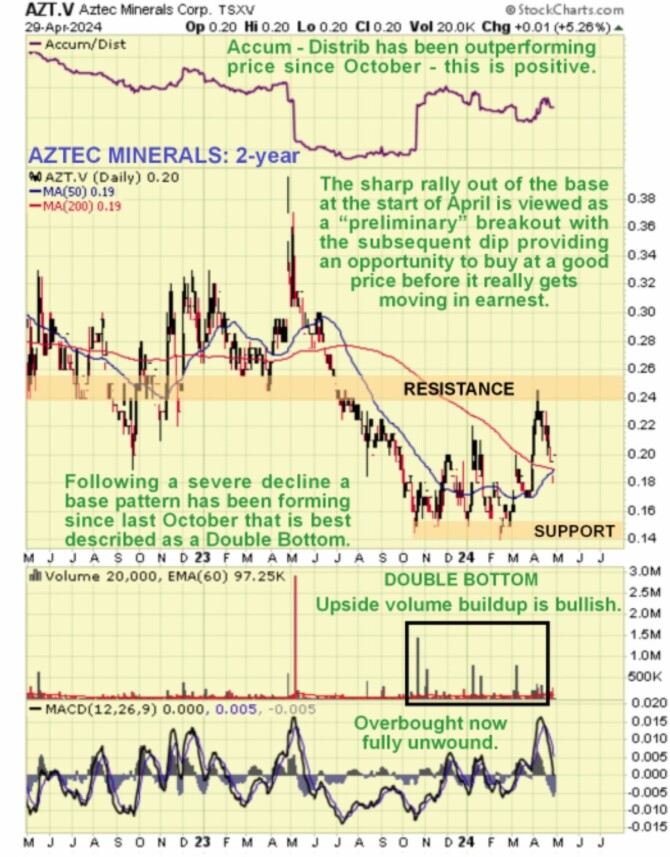
Zooming in now using a 2-year chart, we see that a severe decline followed the spike high almost a year ago last April, and this has been followed by a base pattern building out from last October that is best classified as a Double Bottom.
We can see that there has been good upside volume as this base pattern has formed, which has driven the Accumulation line higher. This is bullish. The sharp rally around the start of this month is a sign that this base pattern is complete, and we will now look at recent action in more detail on a 7-month chart, this time period being selected to enable us to see the first low of base pattern which occurred last October.
On the 7-month chart, we can see the base pattern almost entirely, and the attempt to break out from it was made early in April. Although the price has reacted back into the base pattern following the breakout attempt, this action is not viewed as bearish at all — on the contrary, the attempt at a breakout has served to clear some of the overhanging supply and swung the moving averages into better alignment, paving the way for a more sustained upleg soon.
In addition, we can see that a bullish cross of the moving averages is occurring now, and with the reaction of the past couple of weeks having completely neutralized the earlier overbought condition, all the pieces are in place for the stock to advance anew in a second upleg whose gains will be less likely to be surrendered.
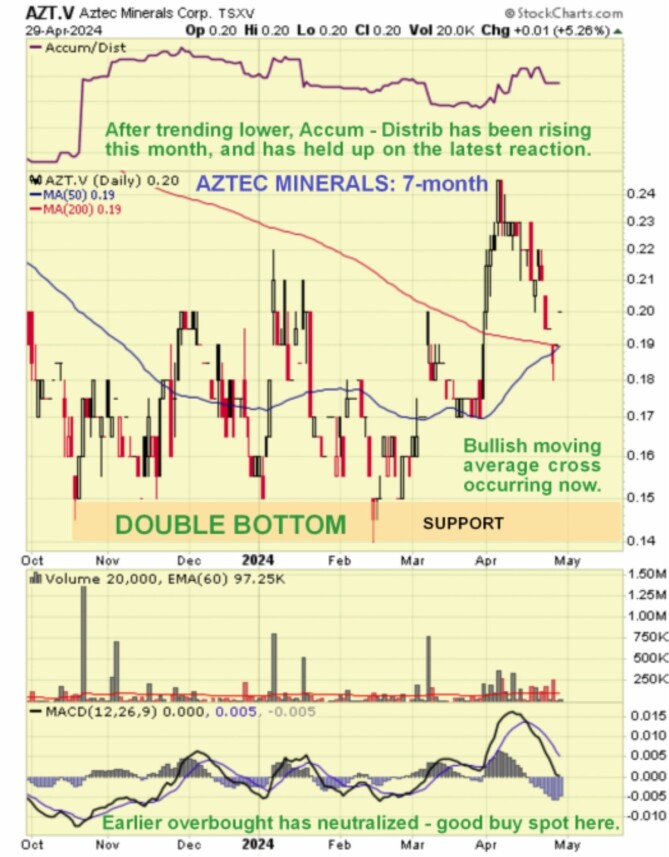
Aztec Minerals is therefore rated a Strong Buy for all timeframes.
Aztec Minerals' website.
Aztec Minerals Corp. (AZT:TSX.V; AZZTF:OTCQB) closed for trading at CA$0.20, US$0.147 on May 2, 2024
Want to be the first to know about interesting Gold and Silver investment ideas? Sign up to receive the FREE Streetwise Reports' newsletter.
Subscribe
Important Disclosures:
- For this article, the Company has paid Street Smart, an affiliate of Streetwise Reports, US$1,500.
- As of the date of this article, officers and/or employees of Streetwise Reports LLC (including members of their household) own securities of Agnico Eagle Mines Ltd. and Osisko Gold Royalties Ltd.
- Author Certification and Compensation: [Clive Maund of clivemaund.com] was retained and compensated as an independent contractor by Street Smart to write this article. Mr. Maund is a technical analyst who analyzes historical trading data and he received his UK Technical Analysts’ Diploma in 1989. The recommendations and opinions expressed in this content reflect the personal, independent, and objective views of the author regarding any and all of the companies discussed. No part of the compensation received by the author was, is, or will be directly or indirectly tied to the specific recommendations or views expressed.
- Statements and opinions expressed are the opinions of the author and not of Streetwise Reports, Street Smart, or their officers. The author is wholly responsible for the accuracy of the statements. Streetwise Reports requires contributing authors to disclose any shareholdings in, or economic relationships with, companies that they write about. Any disclosures from the author can be found below. Streetwise Reports relies upon the authors to accurately provide this information and Streetwise Reports has no means of verifying its accuracy.
- This article does not constitute investment advice and is not a solicitation for any investment. Streetwise Reports does not render general or specific investment advice and the information on Streetwise Reports should not be considered a recommendation to buy or sell any security. Each reader is encouraged to consult with his or her personal financial adviser and perform their own comprehensive investment research. By opening this page, each reader accepts and agrees to Streetwise Reports' terms of use and full legal disclaimer. Streetwise Reports does not endorse or recommend the business, products, services, or securities of any company.
For additional disclosures, please click here.
Clivemaund.com Disclosures
The above represents the opinion and analysis of Mr. Maund, based on data available to him, at the time of writing. Mr. Maund's opinions are his own, and are not a recommendation or an offer to buy or sell securities. As trading and investing in any financial markets may involve serious risk of loss, Mr. Maund recommends that you consult with a qualified investment advisor, one licensed by appropriate regulatory agencies in your legal jurisdiction, and do your own due diligence and research when making any kind of a transaction with financial ramifications. Although a qualified and experienced stock market analyst, Clive Maund is not a Registered Securities Advisor. Therefore Mr. Maund's opinions on the market and stocks cannot be construed as a recommendation or solicitation to buy and sell securities.


