Blackwolf Copper & Gold Ltd. (TSXV.BWCG;OTC:BWCGF) is regarded as an unusually attractive mining stock here for several reasons. A big one is that its current very low valuation means that it has big upside potential and concomitant potential for extraordinary percentage gains. Although the stock has suffered a horrendous decline in recent years the flip side of this is that it makes it a "no-brainer" investment for new buyers here, as its real world assets have not declined in value and if anything have risen in value, especially it is in possession of a 6 million ton NI 43–101-compliant resource as of February 2023. A massive unprecedented bull market is also just starting in copper, gold and silver that, to put it mildly, is set to have a hugely beneficial effect on the valuation of miners that are either producers or have demonstrably promising projects and prospects, such as Blackwolf.
IMPORTANT ANNOUNCEMENT ADDED LATER: after this article was written on the May 1, the huge news emerged on the morning of May 2 that Treasury Metals and Blackwolf to Create New Growth-Focused North American Gold Platform. The news release reads: “Treasury Metals Inc. (TML:TSX: TSRMF:OTCQB) and Blackwolf Copper and Gold Ltd are pleased to announce that they have entered into a definitive arrangement agreement dated May 1, 2024 (the "Agreement") to combine the two companies to advance the Goliath Gold Complex Project ("GGC Project") in Ontario towards production with a strengthened leadership, balance sheet and capital markets team (the "Transaction"). The combined company's Niblack Copper-Gold development project in Alaska and other exploration properties also represent promising upside projects for future growth.”
Renowned mining financier Frank Giustra, who is Blackwolf’s largest shareholder and is the expected largest shareholder of the combined company, commented within the release, "This is a strong transaction for Blackwolf and Treasury shareholders that puts the company on the path of a buy and build strategy that I have implemented many times. We see the GGC Project as buildable and expandable on a district scale. I look forward to continuing to be a supportive shareholder and am excited to join the team as a Strategic Advisor."
We will now review a selection of slides from the company’s website and their latest Investor Deck to see why, from a fundamental standpoint, it is such an attractive investment here before moving on to examine its stock charts, which will make a compelling case for buying the stock here.
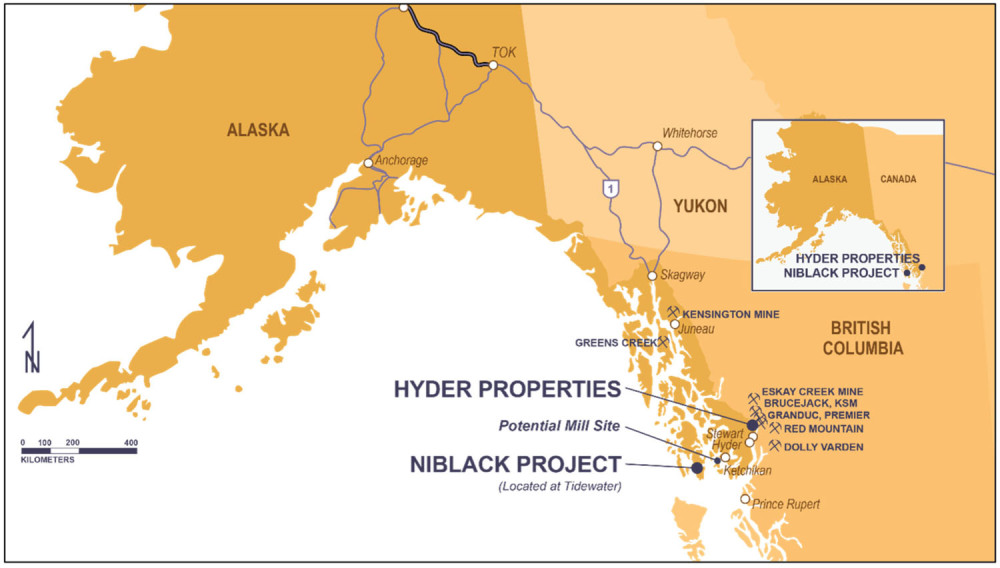
We’ll start by overviewing where the company’s three properties are located on the following map. They straddle the extreme southeast Alaska border with British Columbia on the west side of BC’s Golden Triangle.
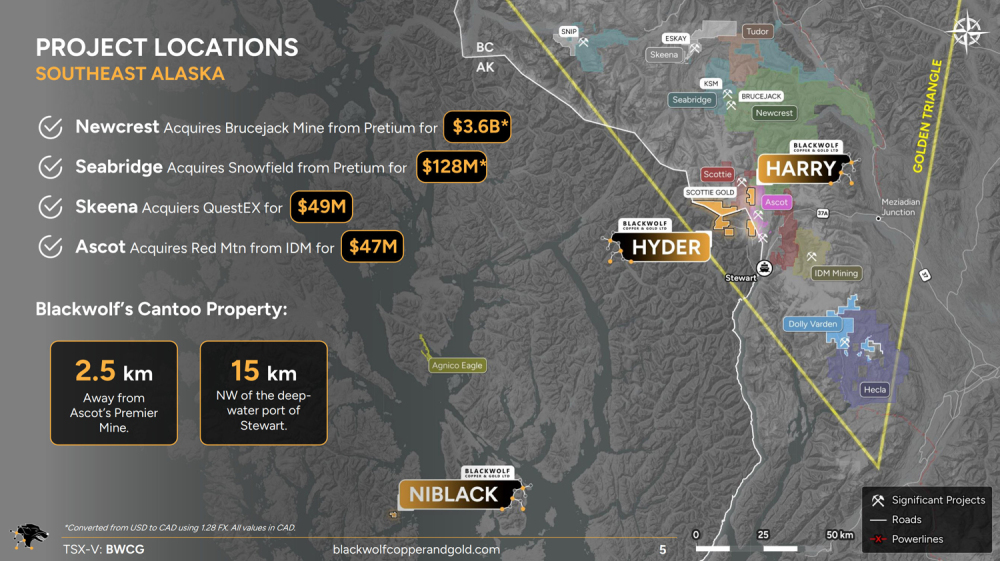
Zooming in, we can see more clearly on the following slide exactly where the projects are and how they are in good company with significant players like Agnico Eagle, Ascot, Dolly Varden, Newcrest, Skeena and Seabridge and others active not far away.
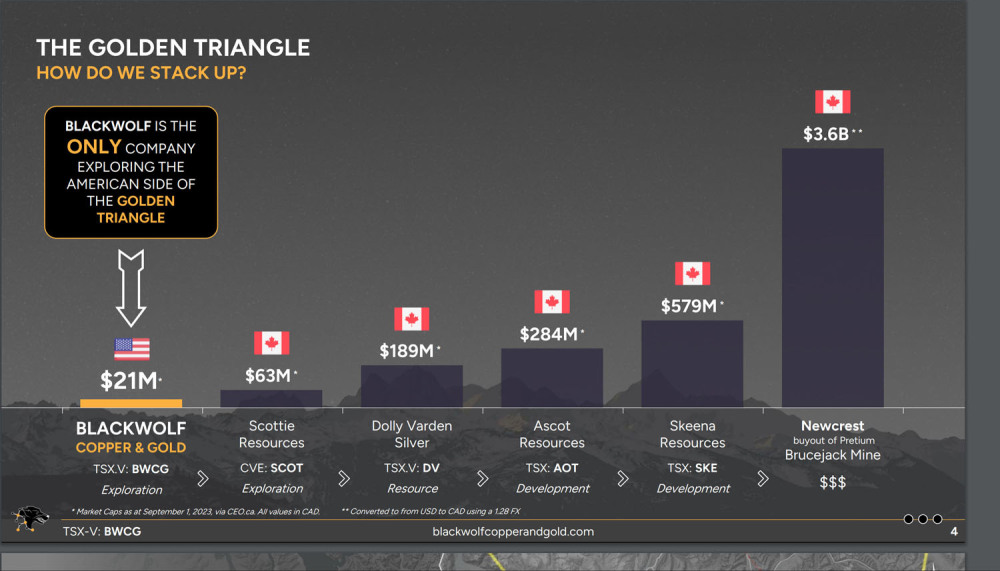
The next slide shows that Blackwolf has a very low valuation relative to other companies operating nearby in The Golden Triangle, a situation that could rapidly change depending on what they find.
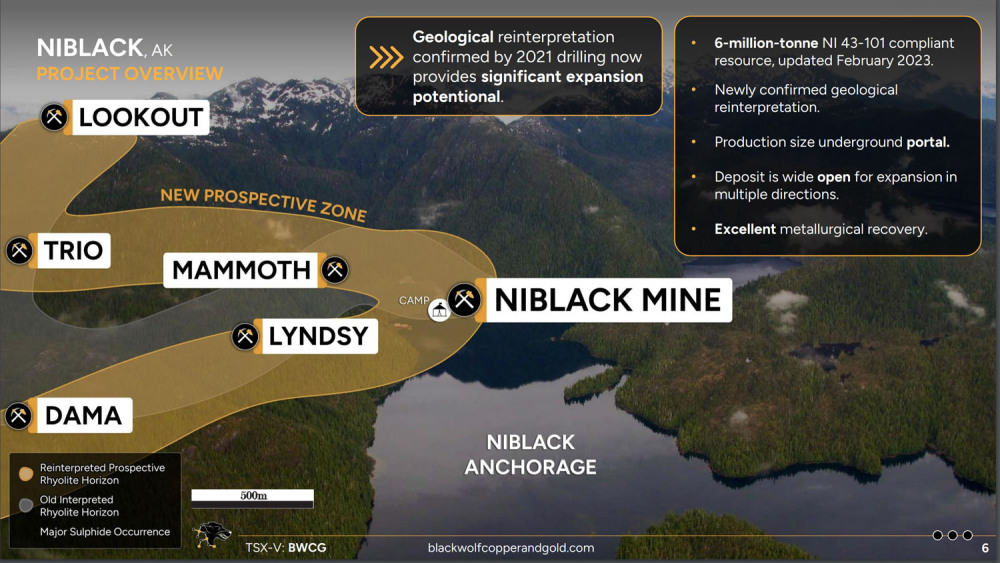
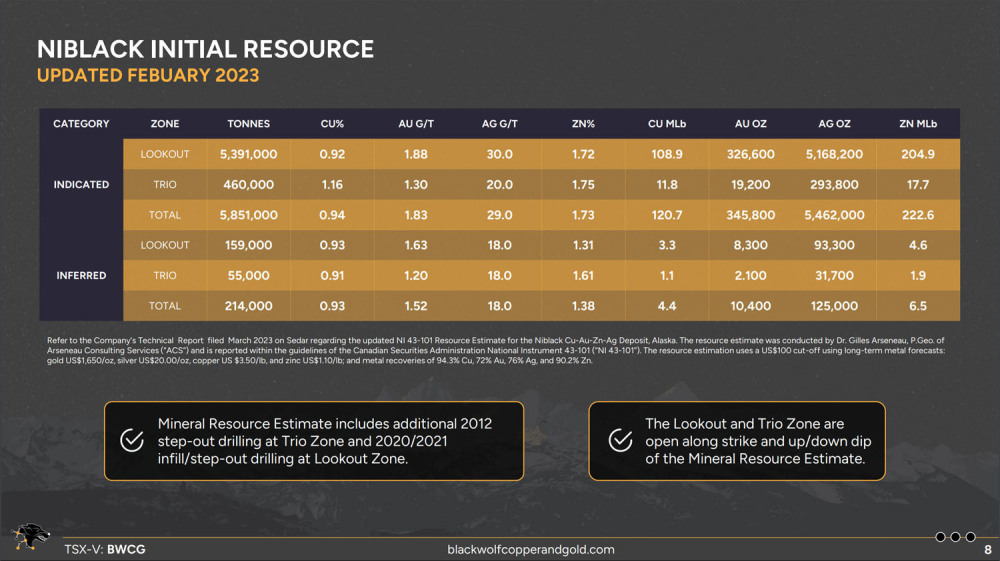
The following slide gives details of the Niblack property, which is the westernmost project situated in Alaska. This is the one with the 6-million-ton NI 43-101 defined resource.
The following table gives NI 43 -101 compliant indicated and inferred resource stats at Niblack.
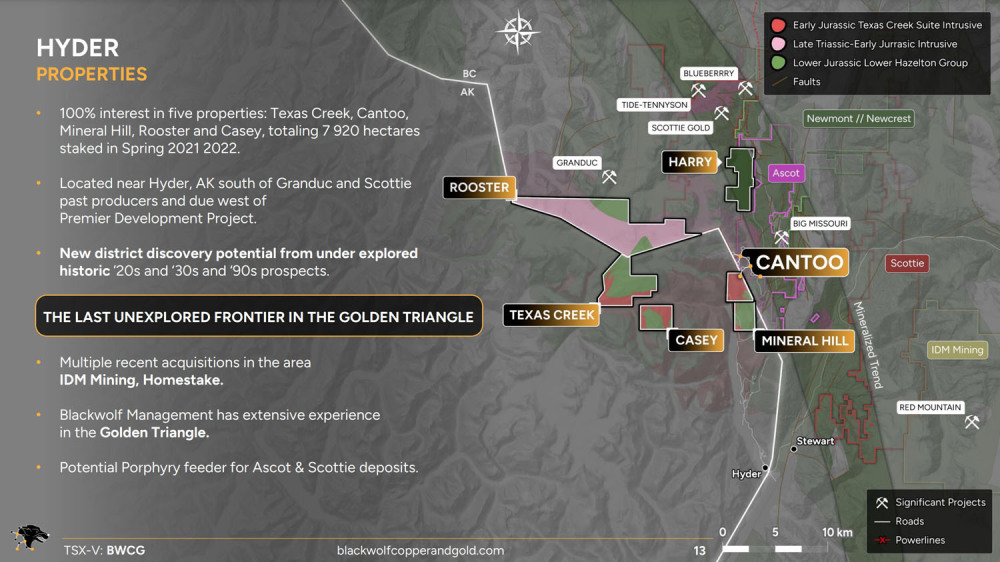
Details of the Hyder group of properties, which are in Alaska but not far west of the border with BC and the western boundary of the Golden Triangle and also just west of Scottie Gold’s properties, are shown on this slide.
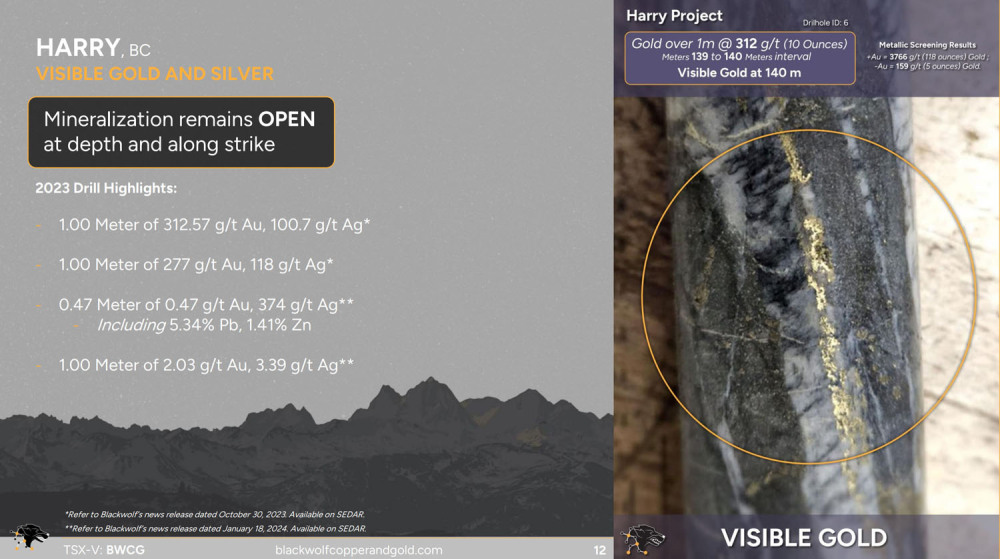
The next slide gives the 2023 drill highlights at the Harry property which is in BC and well inside the Golden Triangle. There is visible gold and silver on the Harry property and a photo of it is included on the right side of this slide, which will help you distinguish it from fool’s gold.
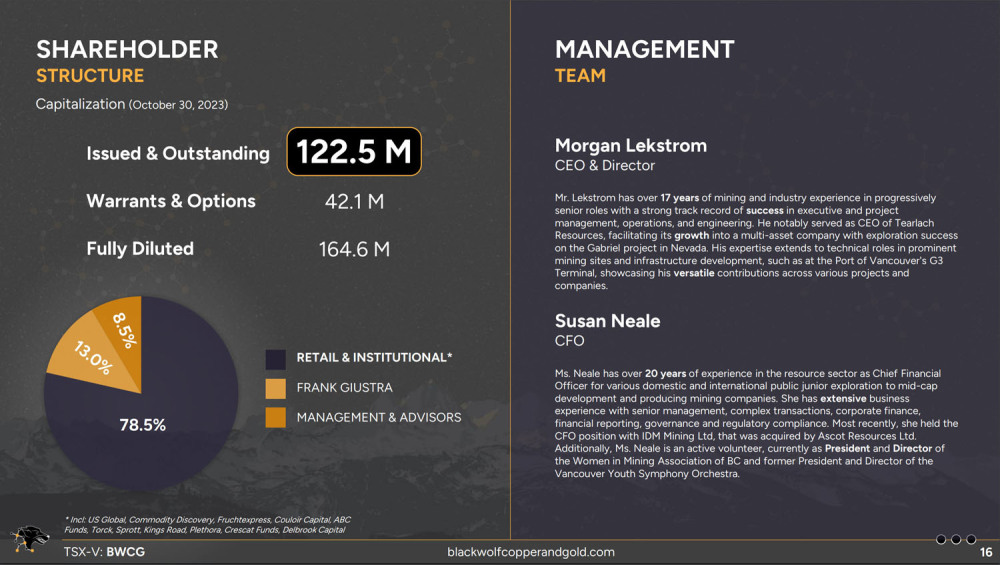
Our next slide shows the capital structure and sets out that there are 122.5 million shares in issue, of which 8.5% are owned by management and insiders with 13% owned by the legendary mining financier Mr Frank Giustra, who rarely invests more than 9% in junior mining companies, so this is taken as a vote of confidence by him.
With exploration work ongoing at all of the company’s properties, the potential for resource growth is clear, and the value of whatever is found will increase as the price of metals continues to rise as the company becomes more and more attractive to majors and mid-caps looking to increase their resource base.
Now we will review the stock charts for Blackwolf and ususually, we will be looking at as many as five charts, made necessary by the long history and at times erratic movements of the stock ,and we will be zooming in on it progressively in “Russian dolls” style in order to more fully understand what is going on.
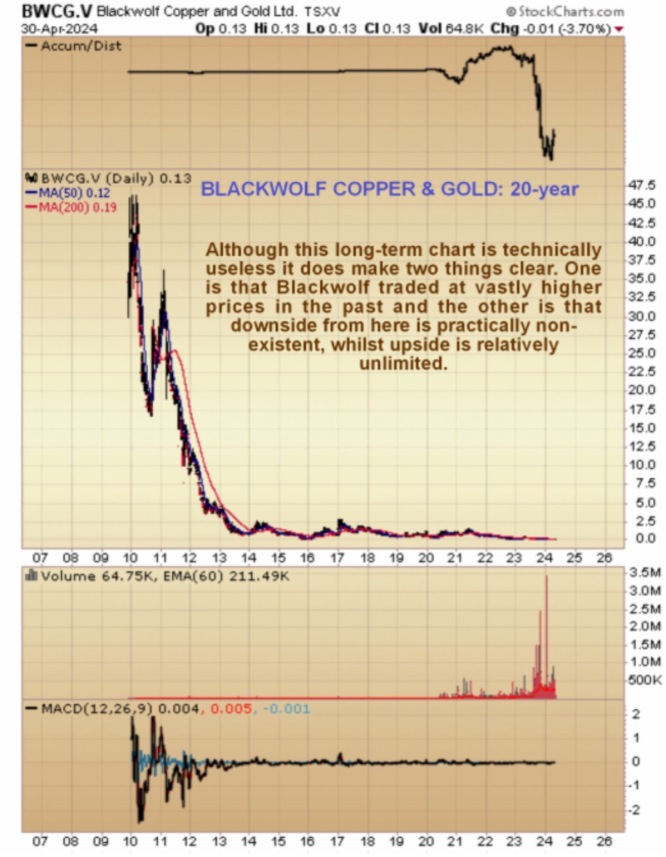
The first chart we will look at is the very long-term 20-year chart and whilst this chart is technically useless it does at least make clear two points. The first is that long ago Blackwolf attained the giddy heights of CA$46, back in 2010, but then it sank like a stone, losing most of its value by late 2013, after which it has run off sideways in a broad trading range that looks flat on this chart. The other point made very clear by this chart is that downside from here is practically non-existent since by historical standards it is now worthless, so we have the virtuous combination of very limited downside and comparatively unlimited upside, and that becomes very interesting when you see the evidence of recent accumulation of the stock that we will consider shortly.
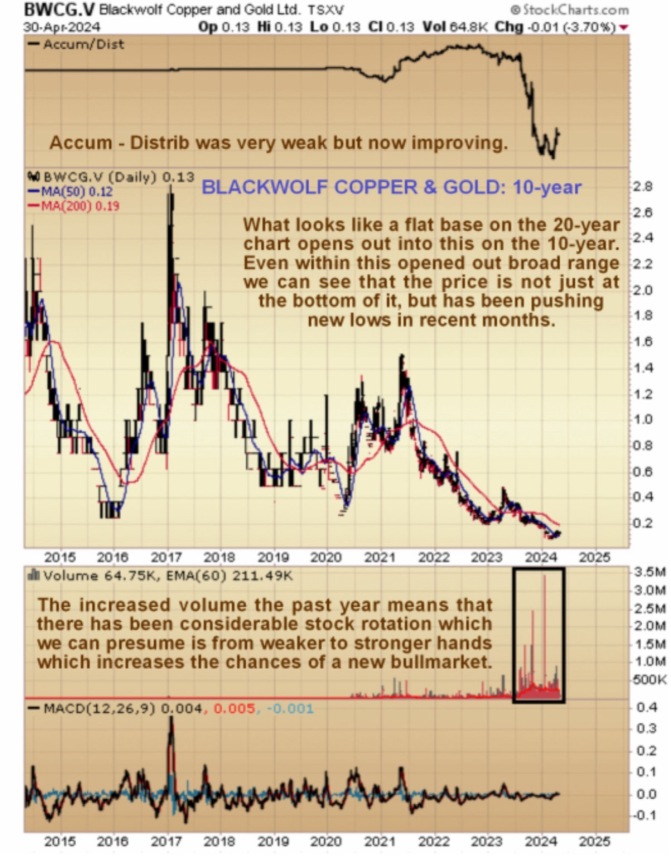
By proceeding next to the 10-year chart, we cut out completely the severe bearmarket from 2010 to 2013 which of course has the effect of “opening out” the giant trading range base pattern that has formed since, enabling us to make some sense of what was going on. On this chart we see that during this period the stock has been trading in a wide range bounded by about CA$0.30 at the downside extreme in late 2015 and about CA$2.80 at the upside extreme in 2017, but the drop early this year even took it well below the late 2015 low with it sinking to a dismal CA$0.085 by late February, and it is still only at CA$0.13 at the time of writing.
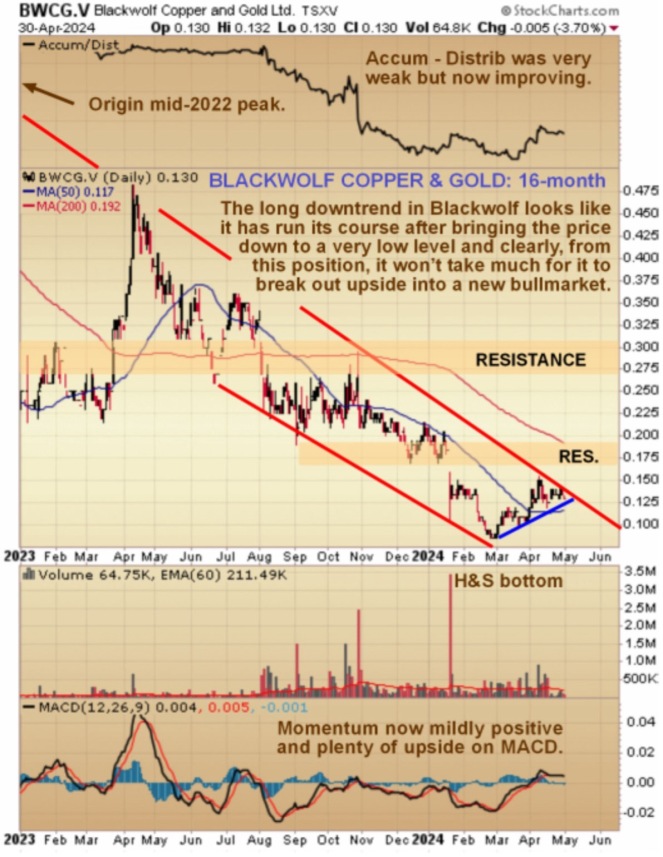
On the four-year chart we see that, even within the broad trading range that we looked at on the 10-year chart, there has been a long and brutal bearmarket from the mid-2021 high approaching CA$1.50 within the downtrend channel shown that brought it all the way down to an extremely low level this February at CA$0.085 as just mentioned above. However, there are a number of important bullish factors evident on this chart that suggest the stock is on the verge of an important reversal to the upside. One is the persistent relatively heavy volume since the middle of last year which if nothing else indicates that a lot of stock has been changing hands, and we can reasonably presume that all this stock has been transferring from weaker to stronger hands since the sellers are obviously for the most part selling at a loss and often a big loss, and many new buyers will not be inclined to sell until they have turned a decent profit. It is thus interesting to observe that upside volume has started to predominate since late February which is a sign that selling around these levels has been largely exhausted and pretty soon that will mean that those wanting to obtain stock will have to bid it up. This increasing upside volume has started to drive the formerly weak Accumulation line higher, which is also bullish and lastly downside momentum (MACD) has been gradually dropping out, setting the stage for an uptrend to develop. As we can see on this chart and the next one, it won’t take much of a move up to break the price out of the downtrend and thus kick off a new bull market.

On the 16-month chart we can see the latter part of the bearmarket that we examined on the four-year chart in much more detail and there are several additional points to observe. We can see that the price has been trending gently higher since late February and pushing towards a breakout from the larger downtrend and it is clear that it has been in a basing process since January, a point underscored by the strengthening Accumulation line and the improving momentum with the 50-day moving average rising for the first time in almost a year. On this chart we can also define the resistance levels that the stock will have to contend with on the way up.
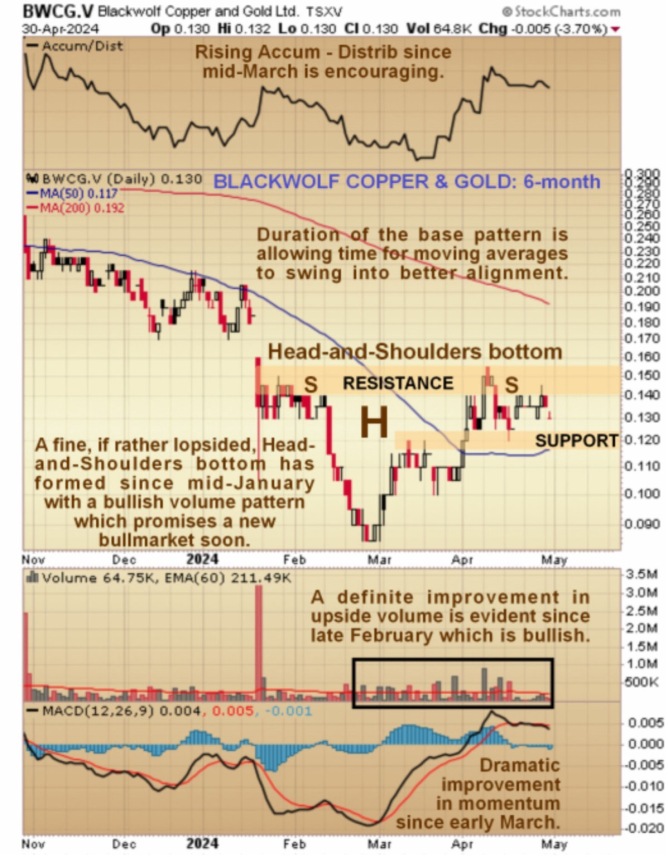
It is on the shorter-term six-month chart that it becomes really clear what has been going on in recent months. For on this chart we can see that a fine, if rather lopsided, Head-and-Shoulders bottom has been forming that now looks very close to completion. Observe the marked improvement in upside volume and in the Accumulation line and in momentum (MACD) as the price has risen out of the low of this pattern all of which is bullish and suggests that a breakout into a new bull market is pending. This base pattern looks complete and so a breakout above the resistance marking its upper boundary is expected to occur soon, probably as soon as the current pressure on the sector lifts or on positive news from the company.
The conclusion is that Blackwolf Copper and Gold is trading at an extremely low price after a severe and prolonged bearmarket and it is showing strong signs that it is very close to completing a low level basing pattern that will soon trigger a breakout into a major new bullmarket against the background of the gathering copper and gold bullmarket. It is therefore rated an immediate Strong Buy for all timeframes.
To end you are referred again to this morning’s huge news out of the company that Treasury Metals and Blackwolf to Create New Growth-Focused North American Gold Platform.
Blackwolf Copper and Gold website.
Blackwolf Copper and Gold Ltd, BWCG.V, BWCGF on OTC, closed at C$0.13, $0.093 on 1st May 24.
Want to be the first to know about interesting Gold investment ideas? Sign up to receive the FREE Streetwise Reports' newsletter.
Subscribe
Important Disclosures:
- Blackwolf Copper & Gold Ltd. is a billboard sponsor of Streetwise Reports and pays SWR a monthly sponsorship fee between US$4,000 and US$5,000. For this article, the Company has paid Street Smart, an affiliate of Streetwise Reports, US$1,500.
- As of the date of this article, officers and/or employees of Streetwise Reports LLC (including members of their household) own securities of Blackwolf Copper & Gold Ltd.
- Author Certification and Compensation: [Clive Maund of clivemaund.com] was retained and compensated as an independent contractor by Street Smart to write this article. Mr. Maund is a technical analyst who analyzes historical trading data and he received his UK Technical Analysts’ Diploma in 1989. The recommendations and opinions expressed in this content reflect the personal, independent, and objective views of the author regarding any and all of the companies discussed. No part of the compensation received by the author was, is, or will be directly or indirectly tied to the specific recommendations or views expressed.
- Statements and opinions expressed are the opinions of the author and not of Streetwise Reports, Street Smart, or their officers. The author is wholly responsible for the accuracy of the statements. Streetwise Reports requires contributing authors to disclose any shareholdings in, or economic relationships with, companies that they write about. Any disclosures from the author can be found below. Streetwise Reports relies upon the authors to accurately provide this information and Streetwise Reports has no means of verifying its accuracy.
- This article does not constitute investment advice and is not a solicitation for any investment. Streetwise Reports does not render general or specific investment advice and the information on Streetwise Reports should not be considered a recommendation to buy or sell any security. Each reader is encouraged to consult with his or her personal financial adviser and perform their own comprehensive investment research. By opening this page, each reader accepts and agrees to Streetwise Reports' terms of use and full legal disclaimer. Streetwise Reports does not endorse or recommend the business, products, services or securities of any company.
For additional disclosures, please click here.
Clivemaund.com Disclosures
The above represents the opinion and analysis of Mr. Maund, based on data available to him, at the time of writing. Mr. Maund's opinions are his own, and are not a recommendation or an offer to buy or sell securities. As trading and investing in any financial markets may involve serious risk of loss, Mr. Maund recommends that you consult with a qualified investment advisor, one licensed by appropriate regulatory agencies in your legal jurisdiction, and do your own due diligence and research when making any kind of a transaction with financial ramifications. Although a qualified and experienced stock market analyst, Clive Maund is not a Registered Securities Advisor. Therefore Mr. Maund's opinions on the market and stocks cannot be construed as a recommendation or solicitation to buy and sell securities.


