This is a BIG story. If you are interested in the mining world, you will find this interesting. If you are interested in making BIG returns out of your investments, you will find this interesting. If you are interested in both, you ought to find it fascinating.
Freeport Resources Inc. (FRI:TSX.V; FEERF:OTCQB; 4XH:FSE) is the 100% owner of the giant Yandera copper project in Papua New Guinea, and we should note here that once it's up and running, it will also be producing significant quantities of gold and molybdenum.
Yandera is a project of strategic national interest in PNG and has the potential to become one of the country's most significant copper mines. The reason that Freeport's stock is still so cheap is simple — the project was in limbo for the past two years, pending approval of the license, which has now been issued by PNG.
The objective of this report is to make it crystal clear to you why Freeport's stock has such a huge upside and, therefore, why it is such an outstanding investment here.
Freeport will be bought up by a much larger company eager to secure future supplies by getting its hands on Yandera. If this happens, as an investor, you will make big gains fast, but probably not as much as over the long-term if the company continues growing as an independent entity, but the point is that either way, as an investor, you win, and win BIG.
Let's start by "setting the stage."
We'll begin by pointing out that the Yandera copper project has already had $200 million spent on it, and while it can be said that some of this inevitably disappeared into a black hole and is "sunk money," a goodly part of it was used to ascertain the potential of the project, which is huge and the results of all this prior work are standing the company in good stead now.
Next, the company is intent on pressing ahead with the project — copper prices are set to soar and not as some short-term spike — they are going to go high and stay high, and this major copper bull market is starting right now.
Why are they set to soar?
Not just because of the general metals bull market that is now, at last, starting to gain traction but even more importantly because of an impending yawning gap between supply and demand, which is set to start to hit as early as next year.
Take a look at the following chart from the company's investor deck.
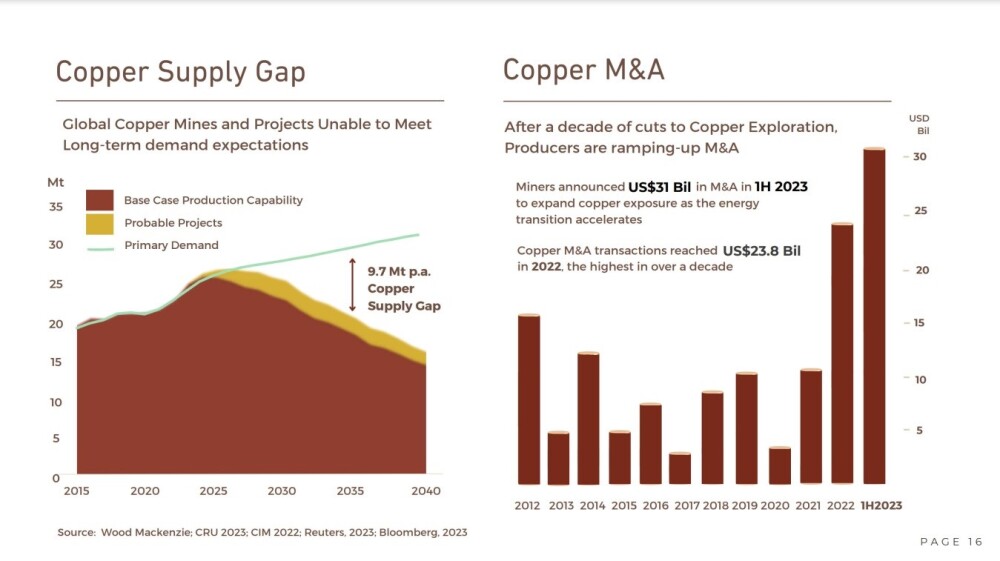
You will no doubt observe that in addition to the yawning supply / demand gap impacting from next year, the right-hand graph shows a massive ramp-up in M&A activity in the copper sector. What this means is that there is an increasing possibility that Freeport will be bought up by a much larger company eager to secure future supplies by getting its hands on Yandera. If this happens, as an investor, you will make big gains fast, but probably not as much as over the long-term if the company continues growing as an independent entity, but the point is that either way, as an investor, you win, and win BIG.
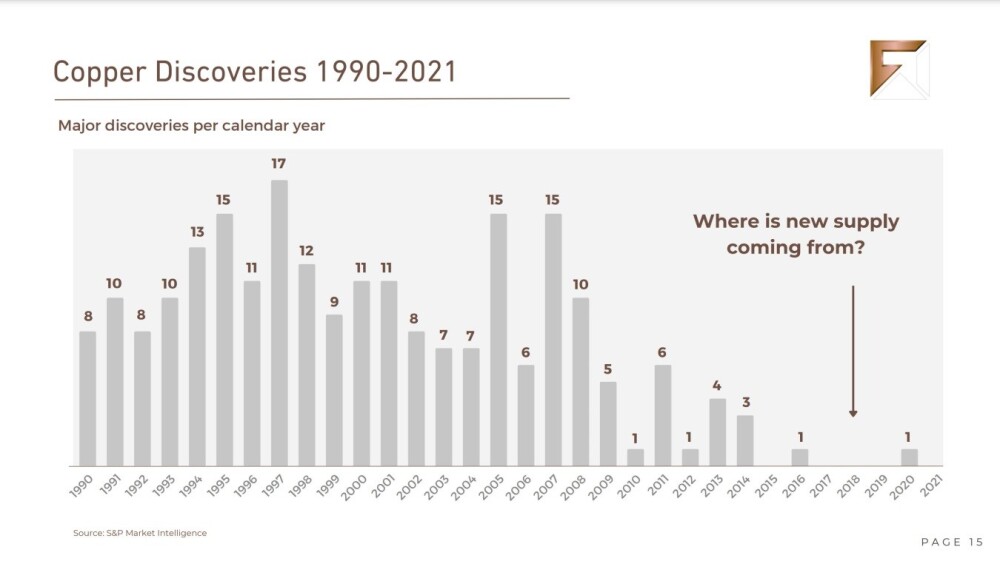
So why, you may ask, is there going to be such a copper supply deficit for the remaining years of this decade?
The answer is provided by the following chart, also from the company's Investor Deck, which shows that there have been virtually no major copper discoveries for nine years now, and before that, they were tailing off. It would seem that a combination of low metal prices and high capital inputs have deterred exploration, and as ever, this is a situation that will right itself through a massive copper price hike that will encourage much more active exploration and intensive utilization of existing sources.
This situation is compounded by the demand for copper undergoing unprecedented structural change driven by the global energy transition. Needless to say, a BIG runup in the price of copper will make the economics of developing the Yandera resource much more workable and encourage the partners that the company is actively looking for to be much more amenable to "stepping up to the plate."
This is a good point to add that although the capital cost of bringing Yandera to production is estimated at close to $1 billion, once up and running, this cost should be recouped in less than six years — less still if the price of copper continues to rise.
Speaking of the economics of the project, this is a good point to work in that "There have been a number of new breakthrough advances in low-cost, direct sulfide leaching technologies since the Yandera prefeasibility study was completed in 2017. These new technologies allow for direct sulfide leaching at the mine site to produce a final copper cathode product, thereby eliminating the need for a costly concentrator and its attendant operating and transportation costs.
The potential capital, operating, and transportation cost savings are significant and could further strengthen the project's economics and attractiveness to potential strategic partners," commented Gord Friesen, the chief executive officer of Freeport Resources. With respect to these breakthrough technologies and how they will improve the efficiency of copper extraction and production, there is a very interesting (to those in the industry) and comprehensive report out by Goldman Sachs EQUITY RESEARCH dated March 22 in which it states on the first page:
"The looming copper supply deficit our commodities team forecasts is driven not only by a lack of new greenfield mine developments and declining head grades but also falling cathode production at larger mature operations as oxide resources are depleted. Depletion of oxide resources to date has resulted in 1.5-2Mt of idled cathode capacity across North and South America alone. With a copper deficit emerging, the major global copper miners are developing technologies to improve recoveries from harder-to-leach, lower-grade primary sulfide ores to utilize spare cathode capacity, therefore squeezing more production from existing assets. As primary sulfides host the majority of copper resources, developing a low-cost, economic solution would be a breakthrough for the copper industry."
In addition, lower down the first page of this report, it makes clear that "New sulfide leaching technology unlikely to close the deficit: the potential 1Mt of extra copper from new leaching technologies is insufficient to close our commodities team's 5Mt deficit in 2030. Our long-run copper price assumption remains ~$4.5/lb (real $, from 2028). In an environment where a broad range of headwinds face the industry in delivering incremental supply, technological breakthroughs are needed to extract more from the installed resource base."
What this boils down to, from the perspective of Freeport and investors in Freeport, is that these new technologies will be insufficient to close the supply shortfall and thus lower the price of copper, but at the same time, they will mean cost savings and greater productivity for existing and new mines coming on stream like Freeport and meaning improvements to the bottom line.
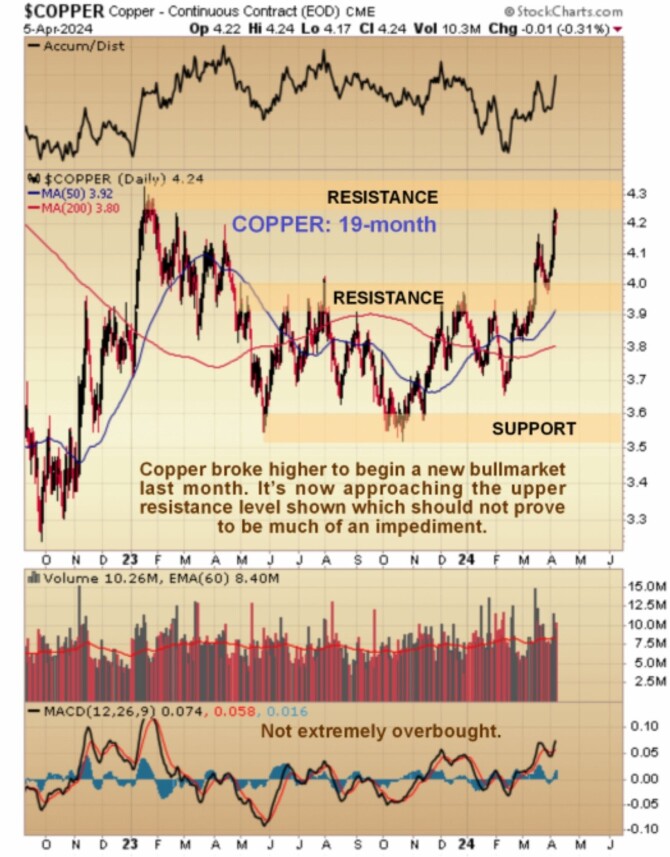
The copper price is already starting to move, as this 19-month chart makes clear — just last month, it broke higher.
The following slide drives home the magnitude of the impending copper supply gap and also shows the growth in demand for copper for key energy transition applications through 2035.
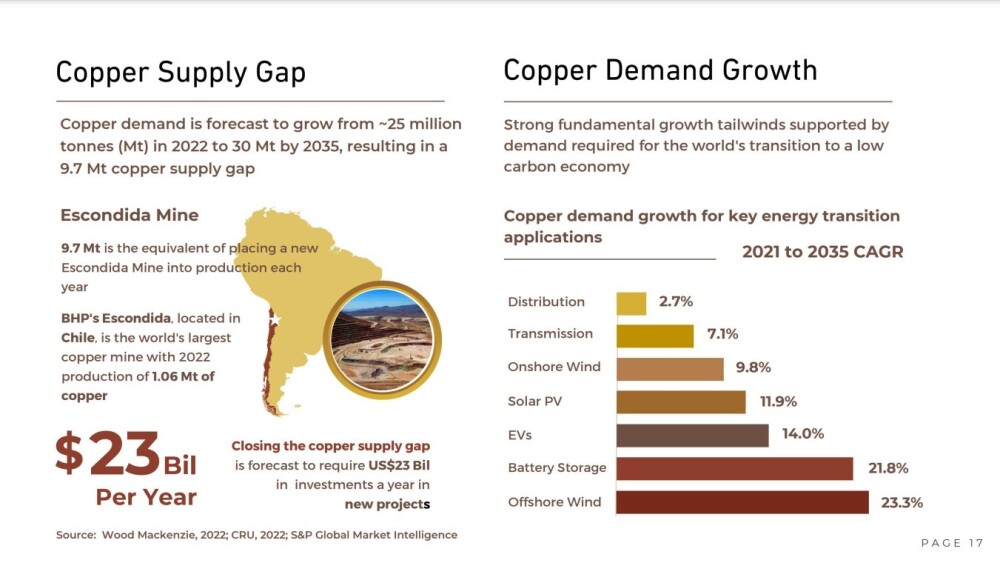
A BIG advantage that the company has is that the Yandera Project or mine to be is geographically close to Asia, the world's largest copper refiner and consumer, which positions Yandera as an attractive potential long-term source of copper supply.
Now that we have covered these important general background factors, we will proceed to look at the company's specifics and the giant Yandera Project.
The following slide sets out the most important general points about the company.
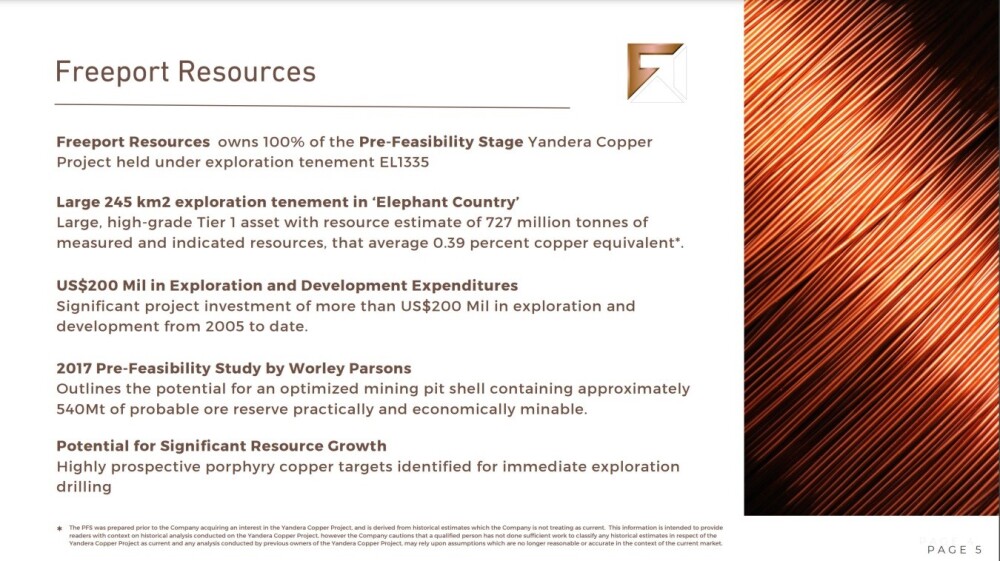
There are several key points to note:
- Freeport owns 100% of the pre-feasibility Yandera Project.
- The land area is large at 245 square kms with plenty of further discovery potential. The exploration license for the property has been renewed until Nov 2025.
- The $200 million already spent on exploration and development has delineated the resource and brought it to the stage where the project can be quickly advanced.
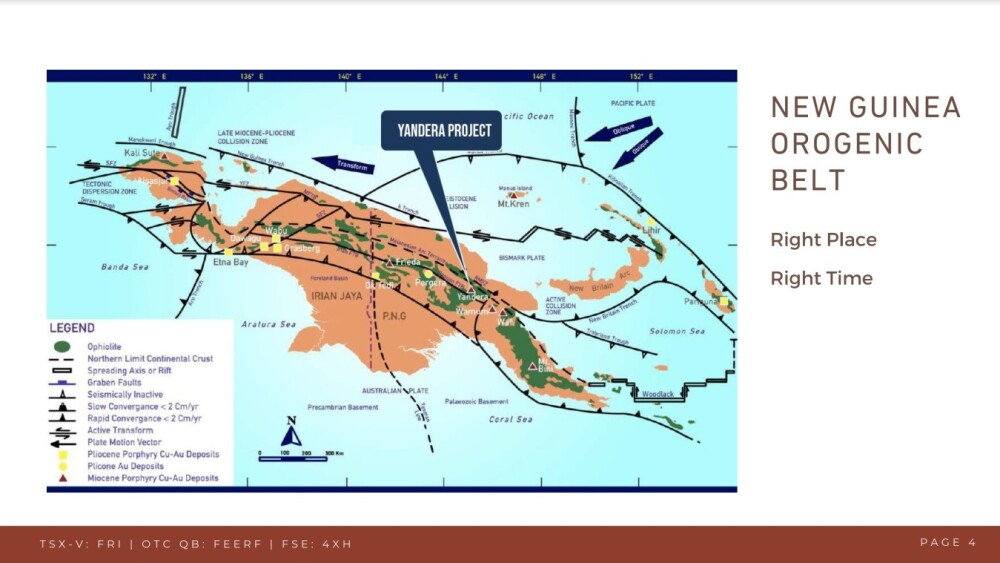
- The next slide shows where the project is located within the New Guinea Orogenic Belt, which extends across the western part of the island that is part of Indonesia.
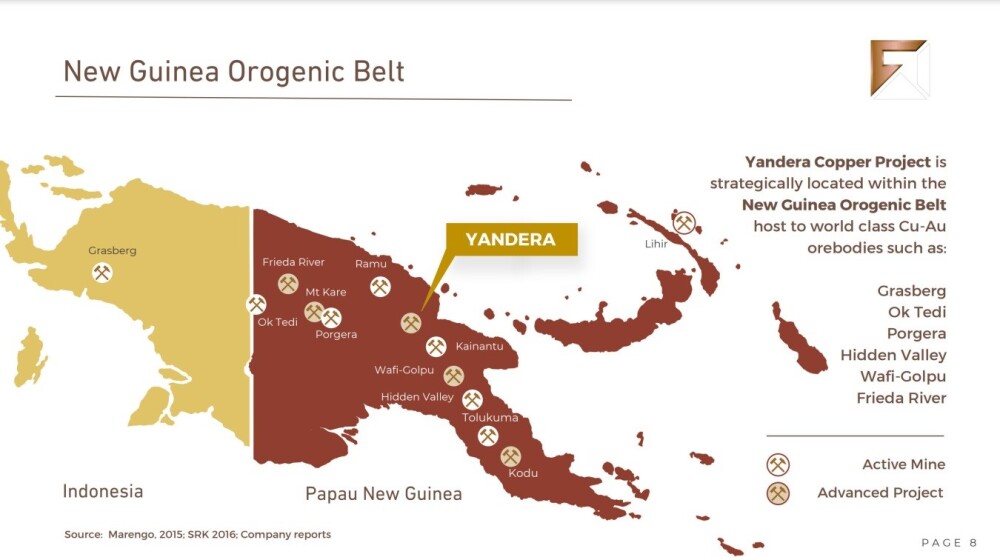
This slide shows where Yandera sits relative to other important copper and gold mines and projects in Papua New Guinea.
Now, we come to a range of interesting slides that demonstrate both the economics of the Yandera Project and the potential for huge revaluation of the company.
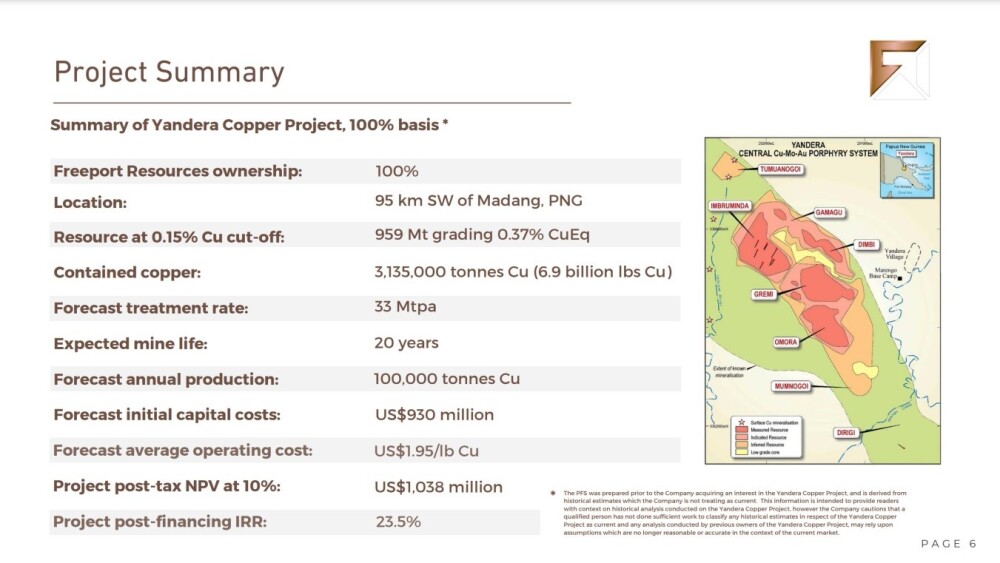
We'll start with this one, which overviews the project.
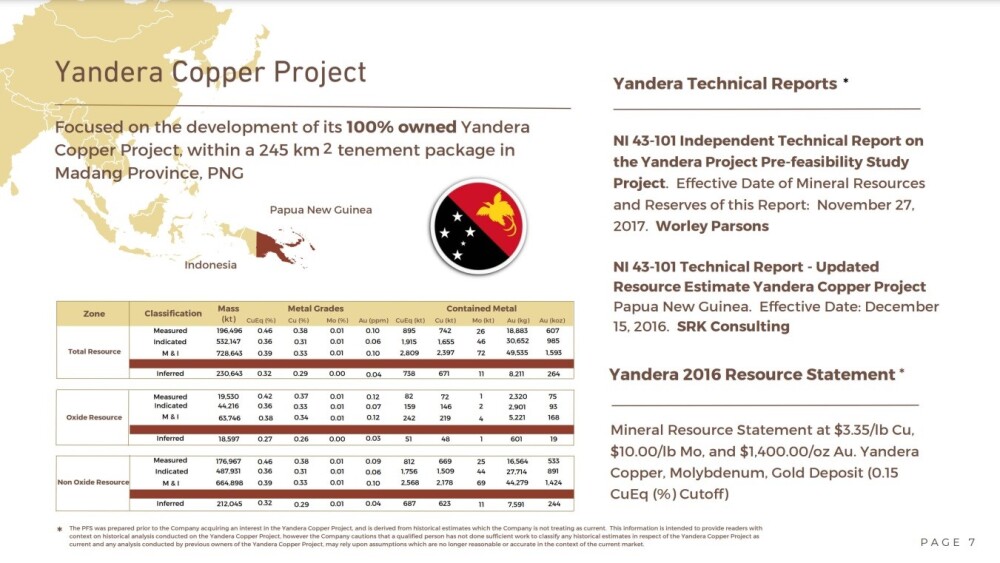
The next slide shows details of the resources contained within the project.
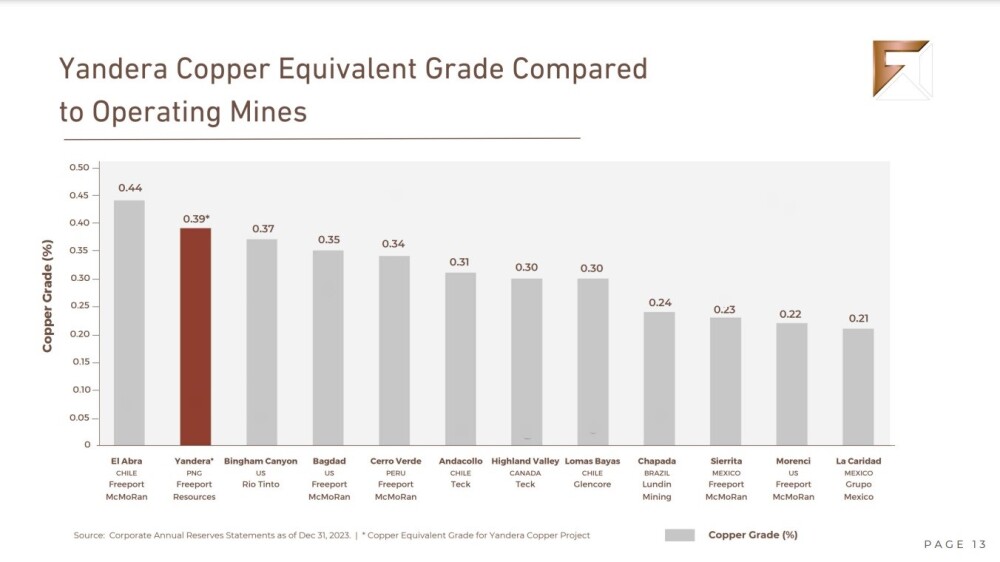
This slide shows Yandera's average copper equivalent grades compared to a range of important operating mines, which, as we can see, are comparable.
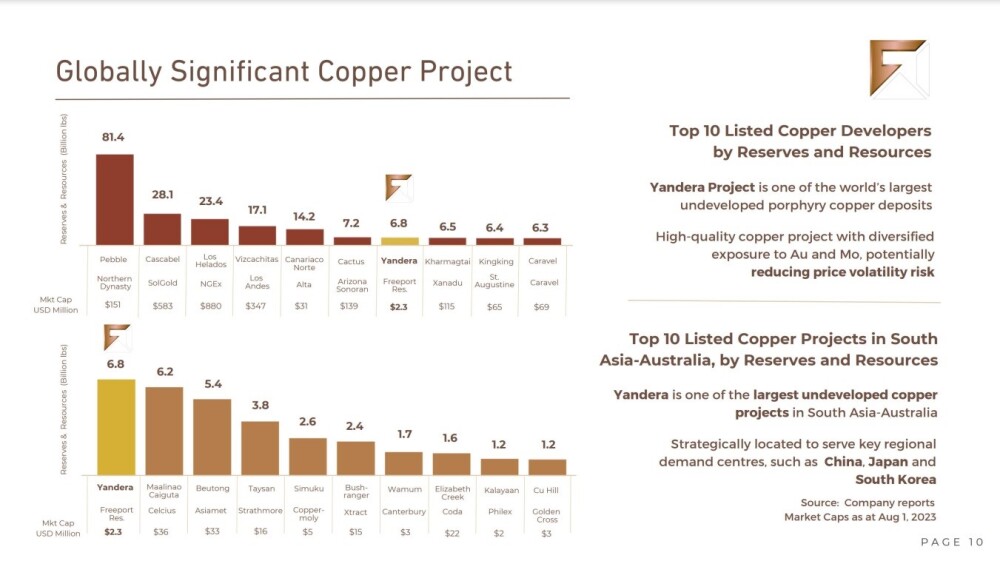
The following important slide shows that Yandera is set to be a globally significant copper producer and the biggest in the South Asia and Australasia region.
Whilst we know and understand the reasons for it, Freeport is grossly undervalued relative to its peers and the next slide makes this dramatically clear and gives its (correct) rerate upside potential at 20X.
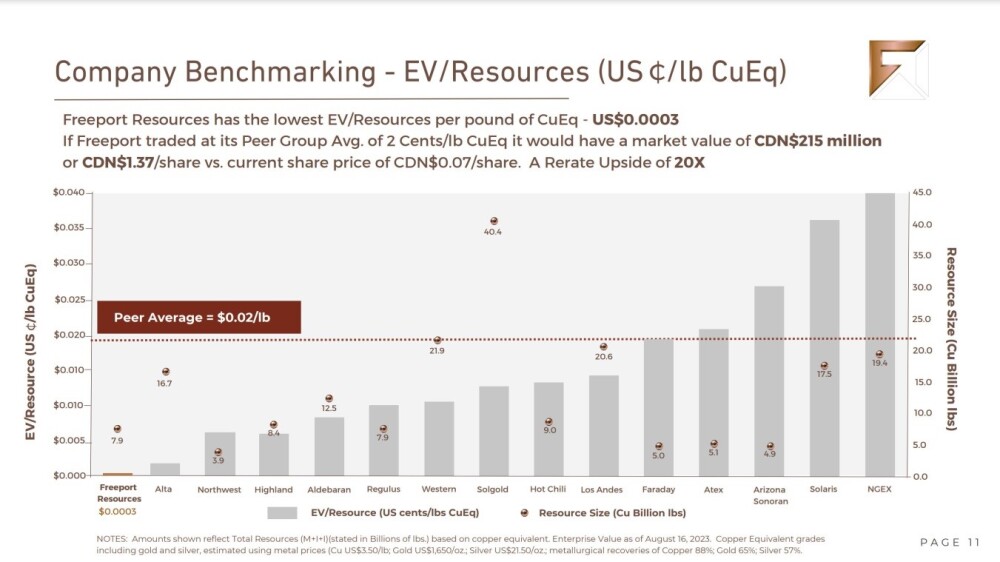
Finally, you may require a magnifying glass to see how Freeport's current market cap compares to its peers.
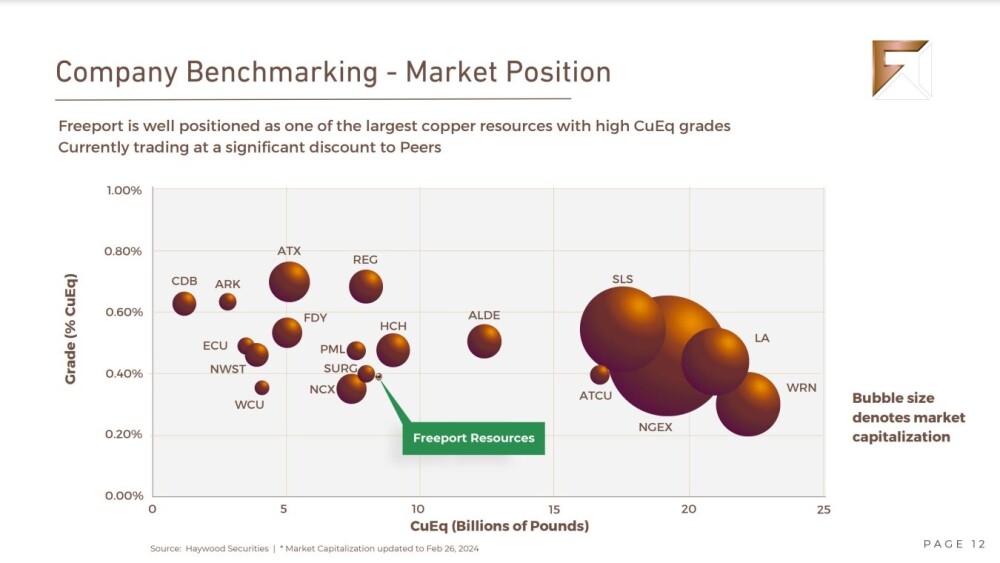
If this doesn't give you an idea of how undervalued it currently is and its potential for appreciation, then nothing will.
Now we examine the stock charts for Freeport Resources, which demonstrate in the clearest manner possible how undervalued the stock is and its potential for massive appreciation from its current very low price.
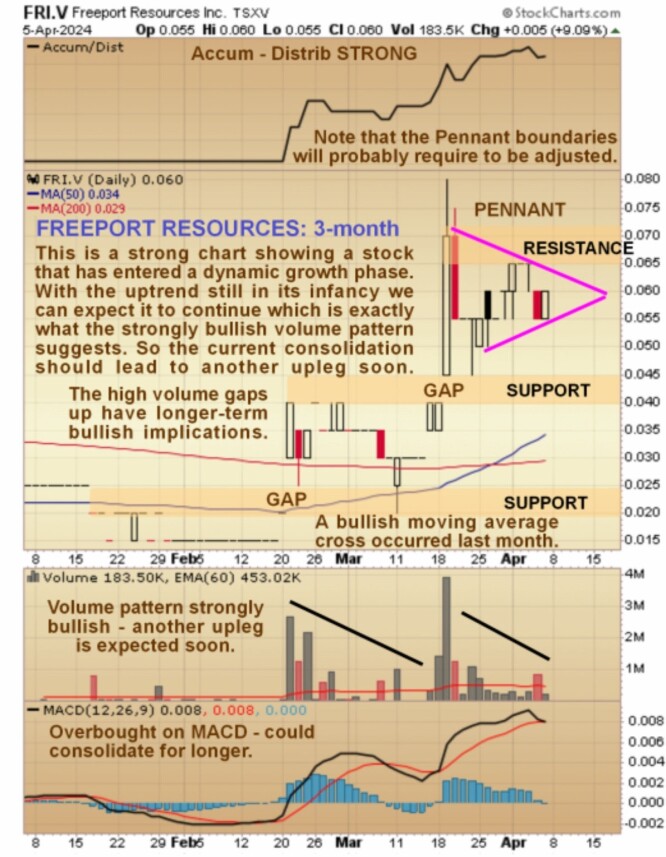
Starting with the shorter-term 3-month chart, we see that after a long period of dull trading, the price exploded higher on strong volume in February, and in short order, it made a more than 400% gain from its recent lows, although admittedly, this was from a very low level. There have been two steep uplegs so far, both accompanied by very strong volume and a gap, and this exceptionally bullish price / volume action implies that the stock is headed to much higher levels in the future.
The first of these uplegs, in February, can be described as a "preliminary" breakout because soon after, it gave back most of the gains as it reacted back to test support in the base pattern before turning higher again. The second upleg was "the real deal" when it rose more on heavier volume and hasn't since given back most of the gains and instead, we have since seen a bullish cross of the moving averages.
Right now, it is digesting this second upleg with a bull Pennant forming that promises another upleg soon. Since it is still quite heavily overbought on its MACD indicator by recent standards, it is entitled to rest here for longer to allow this overbought condition to unwind more although as it is now in a dynamic advancing phase, it could break higher again at any time. Note that the Pennant boundaries are provisional and may require adjusting, especially if it consolidates for longer.
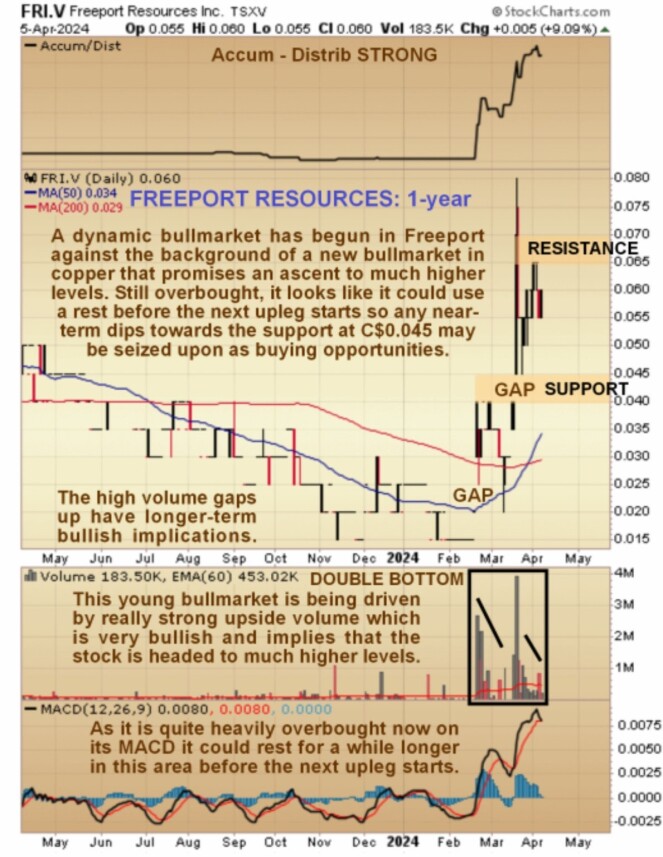
The abrupt change in the fortunes of this stock is thrown into sharp relief by the 1-year chart. On it, we see that after drifting gently lower for many months into a low Double Bottom, the price has blasted higher with seemingly little warning.
Again, the importance of the high volume gap moving higher should be emphasized — this kind of behavior at a low price level is an indication of Smart Money buyers "falling over themselves" to get the stock on board, presumably because they know something that most investors don't.
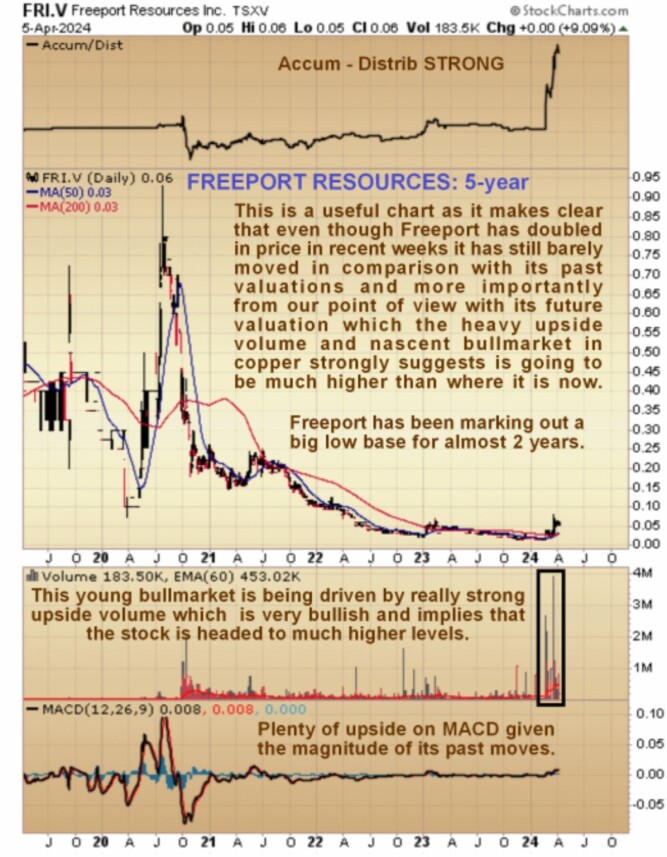
Even though it has risen sharply off its lows, as the charts shown above attest, it is still at a very low price with this new bull market still in its infancy as we can clearly see on its 5-year chart on which we see that it got to over CA$.90 in mid-2020.
So even though it has doubled or trebled off its recent lows, it has barely moved yet in comparison with its prices in the not-so-distant past. This chart is also useful as it shows that Freeport is rising off a low base that formed almost two years ago. So the message of this chart is that there is still a lot to go for, especially given the background of a major new copper bull market that is also starting now.
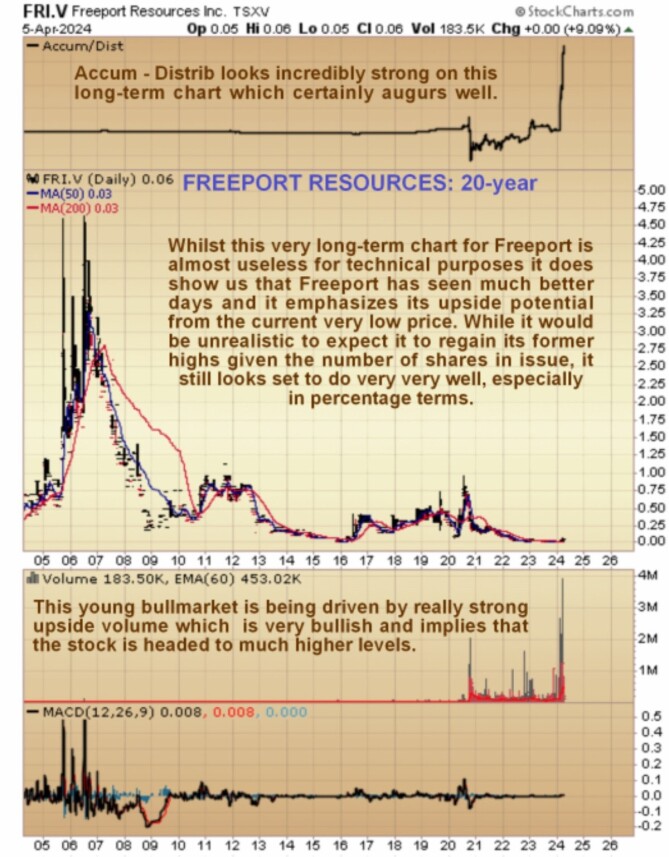
Finally, although the long-term chart 20-year chart is virtually useless for technical purposes, it does at least show us the entire history of the stock and that it has seen much better days, with it getting as high as CA$4.60 or so in the 2000s. This chart certainly emphasizes the big upside from the current very low price, especially given the huge volume driving this still nascent bull market, which has caused a dramatic spike in the Accumulation line.
On this chart, it looks like there is zero downside and huge upside, although, given the now higher number of shares in issue, we should temper our enthusiasm somewhat, so it seems that the gentleman who bought above CA$4.50 in 2006 and has been waiting patiently ever since to "get out even" is likely to be disappointed, but that said there remains the potential for very large percentage gains for investors who buy the stock in this area.
On the 4th of this month, at about midday EDT, the company announced that it would conduct a non-brokered private placement of up to 100 million units at a price of five cents per unit for gross proceeds of up to $5 million. Each unit will consist of one common share of the company and a one-half-of-one share purchase warrant.
Each whole warrant will entitle the holder to acquire an additional common share at a price of 25 cents for a period of 24 months. The offer price is only 1 cent below the current price, and so will have no impact other than that the stock may be constrained until it becomes clear that the offering is being well taken up and approaching being closed, which should not take long.
In conclusion, Freeport is rated a Strong Buy in this area with an awareness that there could be a near-term minor dip towards CA$0.045, although there may be no dip before it takes off higher again. As it has unlimited upside and the near-term risk is a paltry 1 to 1.5 cents it is not considered to be wise for buyers here to angle for a minor dip but instead to go ahead and buy, as angling for a minor dip may result in missing it completely if it runs away to the upside, which is very possible considering the strongly bullish setup.
Freeport Resources' website.
Freeport Resources Inc. (FRI:TSX.V; FEERF:OTCQB; 4XH:FSE) closed at CA$0.06, $0.045 on April 5 24.
Want to be the first to know about interesting Critical Metals and Base Metals investment ideas? Sign up to receive the FREE Streetwise Reports' newsletter.
Subscribe
Important Disclosures:
- For this article, the Company has paid Street Smart, an affiliate of Streetwise Reports, US$1,500 in addition to the monthly consulting fee.
- As of the date of this article, officers and/or employees of Streetwise Reports LLC (including members of their household) own securities of Freeport Resources Inc.
- Author Certification and Compensation: [Clive Maund of clivemaund.com] was retained and compensated as an independent contractor by Street Smart to write this article. Mr. Maund is a technical analyst who analyzes historical trading data and he received his UK Technical Analysts’ Diploma in 1989. The recommendations and opinions expressed in this content reflect the personal, independent, and objective views of the author regarding any and all of the companies discussed. No part of the compensation received by the author was, is, or will be directly or indirectly tied to the specific recommendations or views expressed.
- Statements and opinions expressed are the opinions of the author and not of Streetwise Reports, Street Smart, or their officers. The author is wholly responsible for the accuracy of the statements. Streetwise Reports requires contributing authors to disclose any shareholdings in, or economic relationships with, companies that they write about. Any disclosures from the author can be found below. Streetwise Reports relies upon the authors to accurately provide this information and Streetwise Reports has no means of verifying its accuracy.
- This article does not constitute investment advice and is not a solicitation for any investment. Streetwise Reports does not render general or specific investment advice and the information on Streetwise Reports should not be considered a recommendation to buy or sell any security. Each reader is encouraged to consult with his or her personal financial adviser and perform their own comprehensive investment research. By opening this page, each reader accepts and agrees to Streetwise Reports' terms of use and full legal disclaimer. Streetwise Reports does not endorse or recommend the business, products, services or securities of any company.
For additional disclosures, please click here.
Clivemaund.com Disclosures
The above represents the opinion and analysis of Mr. Maund, based on data available to him, at the time of writing. Mr. Maund's opinions are his own, and are not a recommendation or an offer to buy or sell securities. As trading and investing in any financial markets may involve serious risk of loss, Mr. Maund recommends that you consult with a qualified investment advisor, one licensed by appropriate regulatory agencies in your legal jurisdiction, and do your own due diligence and research when making any kind of a transaction with financial ramifications. Although a qualified and experienced stock market analyst, Clive Maund is not a Registered Securities Advisor. Therefore Mr. Maund's opinions on the market and stocks cannot be construed as a recommendation or solicitation to buy and sell securities.


