Western Exploration Inc. (WEX:TSX.V;WEXPF:OTC) is a gold exploration stock that is viewed as being highly attractive to investors in the sector for several important reasons. In addition to the big reason common to many stocks in the sector which is that gold is powering up for a major bull market which in fact has already begun, there are several other compelling reasons to want to own this stock.
One is that it is primarily a gold explorer and of all the metals gold is set to be the star performer with silver set to do very well later. Another is that the company has already delineated significant reserves at its properties in northern Nevada which is a renowned mining-friendly jurisdiction and still another is that the number of shares available to retail investors is tiny at just 6.5% of the number of shares in issue which itself is a modest 34.4 million. What this means is that any significant increase in demand for the stock could drive a spectacular spike, and the stock is already starting to make significant gains.
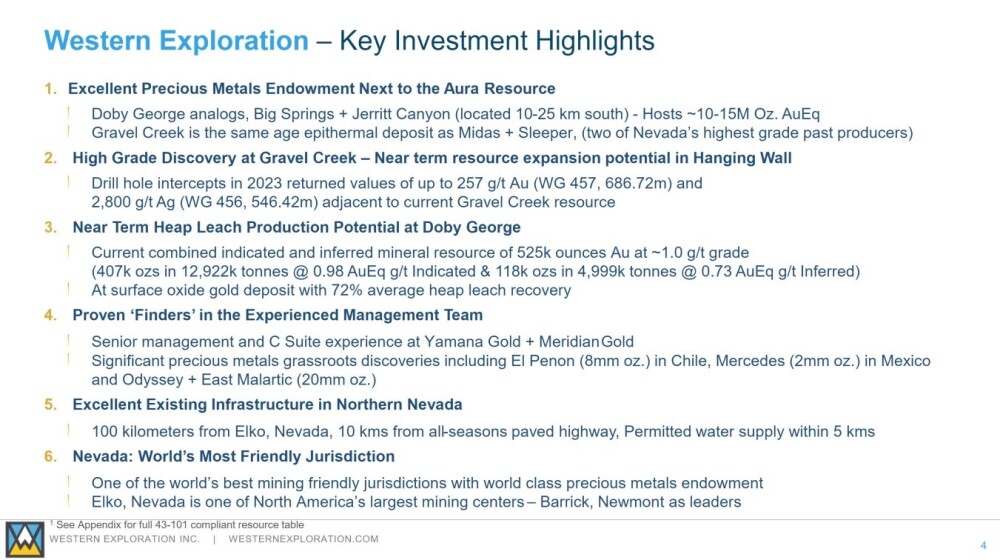
The following slide, lifted from the company's latest investor deck sets out the key investment highlights of Western Exploration.
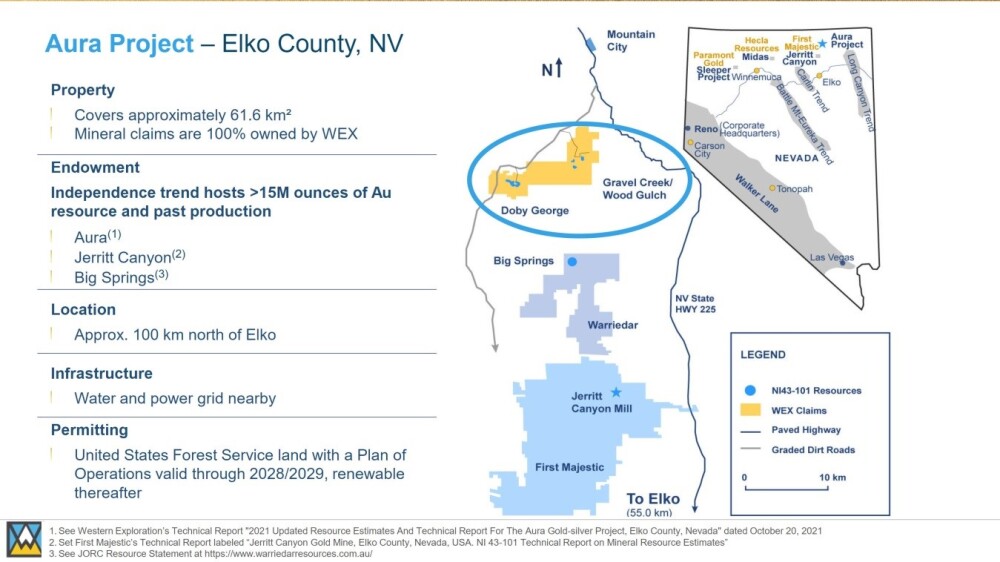
This slide shows the location of the company's main property in northern Nevada which has 2 main ore bearing areas, Doby George and Gravel Creek.
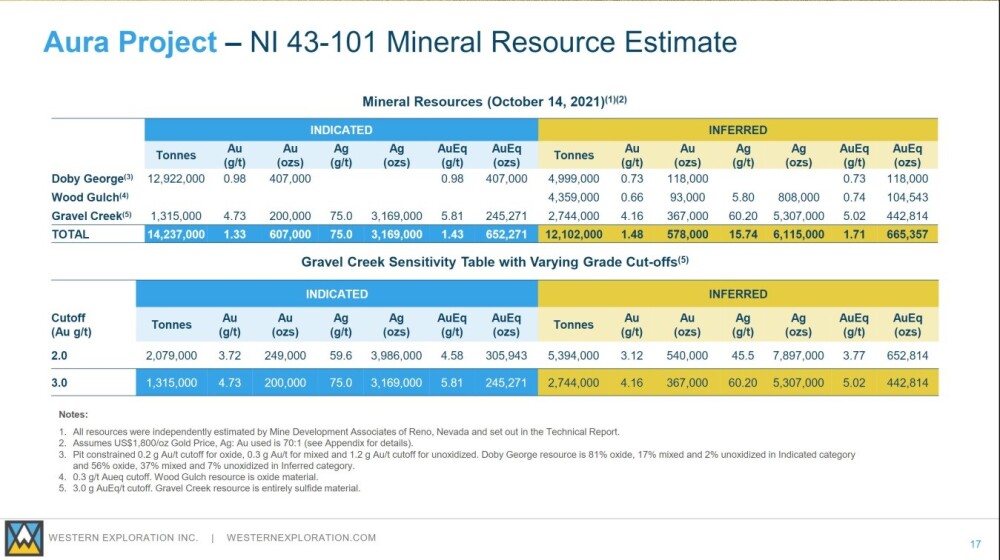
The next slide sets out the MRE (Mineral Resource Estimate) for the Aura Project.
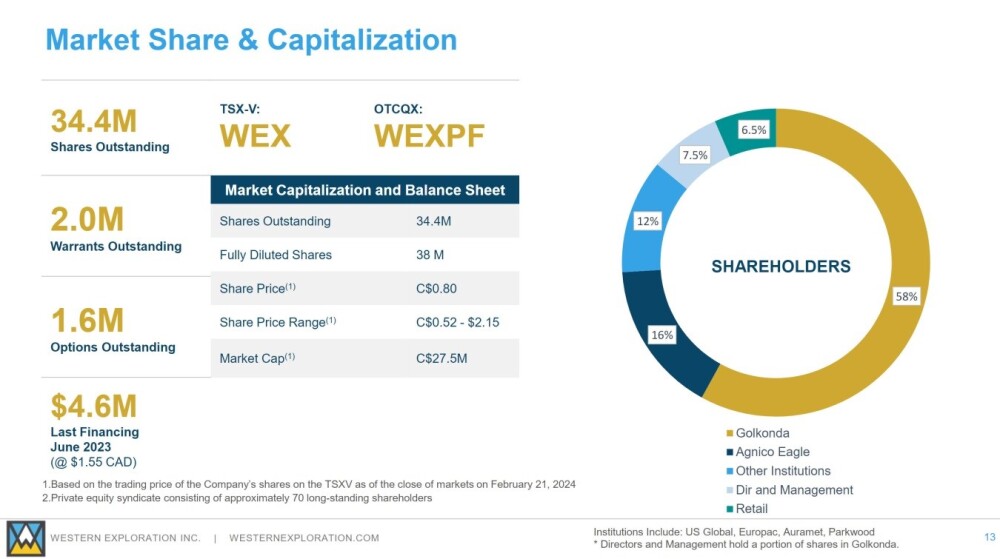
And lastly, and perhaps most importantly for investors, this slide shows the Capital Structure of the company and it reveals that due to Golkonda owning a massive 58% stake in the company, Agnico-Eagle owning a further 16%, other institutions owning 12% and directors and management owning 7.5%, that only leaves a paltry 6.5% or approximately 2.2 million shares in the float for retail investors to buy.
Thus it is clear that once interest in this sector heats up, which looks inevitable and likely sooner rather than later, the scope for speculative gains in a stock such as this is enormous.
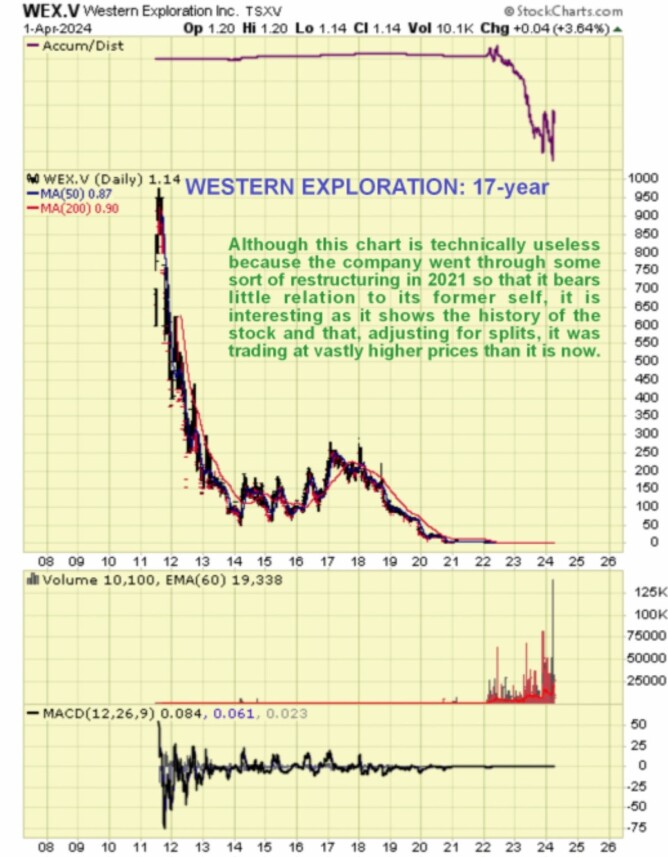
Now we will review the stock charts for Western Exploration. Because the company evidently went through a period of major restructuring from early 2021 through early 2022 so that it bears little relation to its former self we do not need to pay much attention to the chart details prior to this period, but will start by looking at the long-term charts for the purpose of gaining an overall perspective.
On the long-term 17-year chart we can see that, adjusted for splits, the stock traded at vastly higher prices in the distant past than in the recent past. Other than this observation, because of the restructuring mentioned above, this chart is for practical purposes useless.
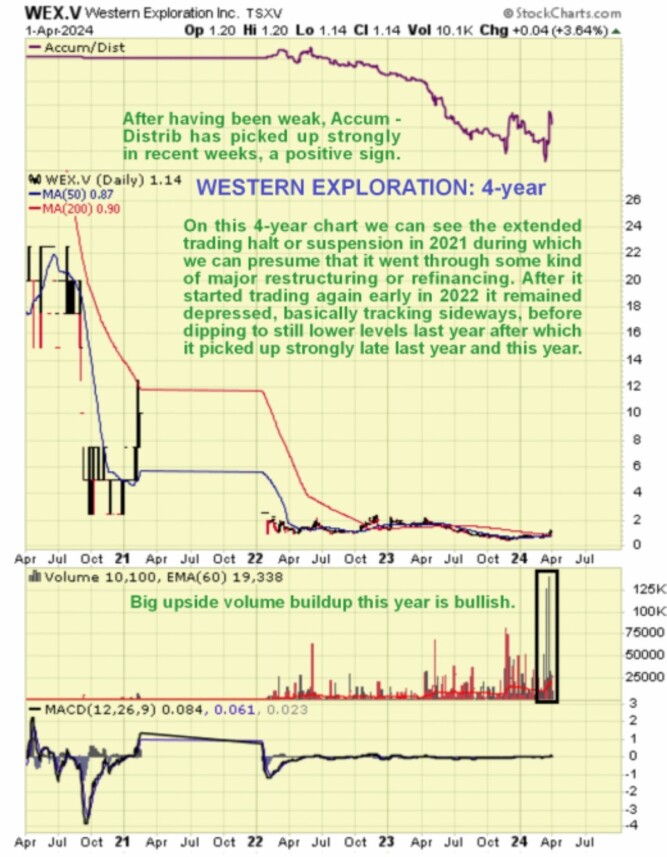
Next we turn to the 4-year chart, which frames the period of the restructuring / refinancing that ran from early 2021 through early 2022 when the stock was halted / suspended, hence the void on the chart during this period.
When it did start trading again it remained depressed, basically tracking sideways and then breaking to the downside and drifting down to a very low level last year and we will now look at this period in more detail on the 30-month chart which has the effect of "opening out" the trading, so that we can see much better what was going on.
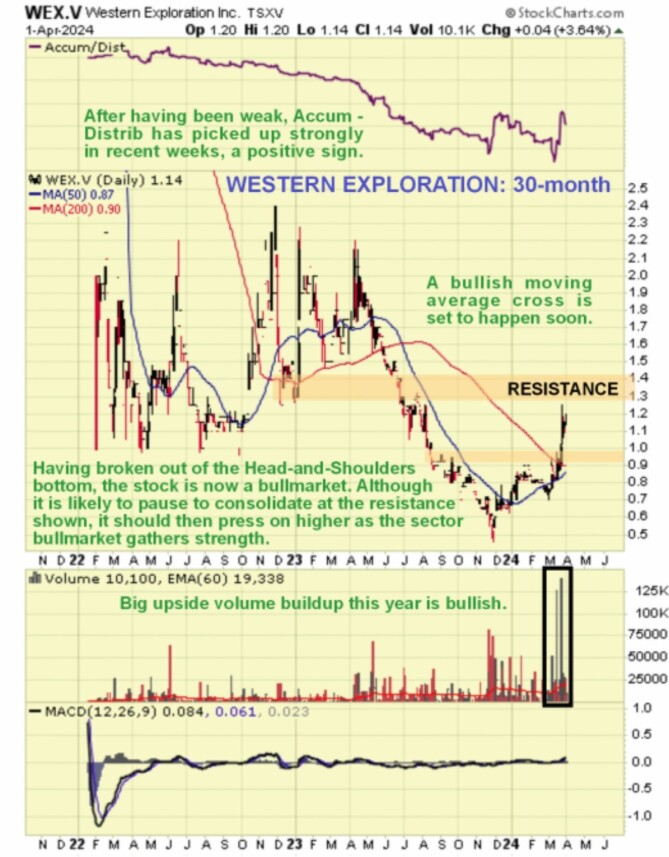
The 30-month chart shows the period from the end of the restructuring right up to the present. On it we see that after drifting sideways in a large trading range bounded by roughly CA$1.00 and CA$2.40 for over a year, it broke into a persistent downtrend last year that took it down to a very low level by the time it hit bottom last November.
It then completed a base pattern which it broke out of on heavy volume in recent weeks to embark on a new bull market against the background of the emerging major metals bull market, in particular gold, and we will now examine this base pattern in more detail and subsequent action on a 1-year log chart.
The 1-year log chart makes it very clear what is going on, and we are using a log chart in this case in order to "open out" the base pattern the better to see how it is shaping up — and the picture it presents is very bullish indeed. For on this chart we see that since last August – September Western Exploration has marked out and completed and broken out of a fine Head-and-Shoulders bottom, with the heavy upside volume on the breakout and advance of recent weeks indicating that this was a genuine breakout into a major new bull market.
It is overbought now on its MACD following the runup of recent weeks and so it is entitled to take a rest and consolidate which it may do here or after advancing a little further into the resistance shown in the CA$1.28 – CA$1.40 zone.
An important point to note is that, while it will encounter and have to work its way through resistance on the way up, whose origins can be observed on the 30-month chart, this resistance is not that great and anyway with gold entering a massive bull market of unprecedented proportions, it will "have the wind at its back" especially with it being primarily a gold stock.
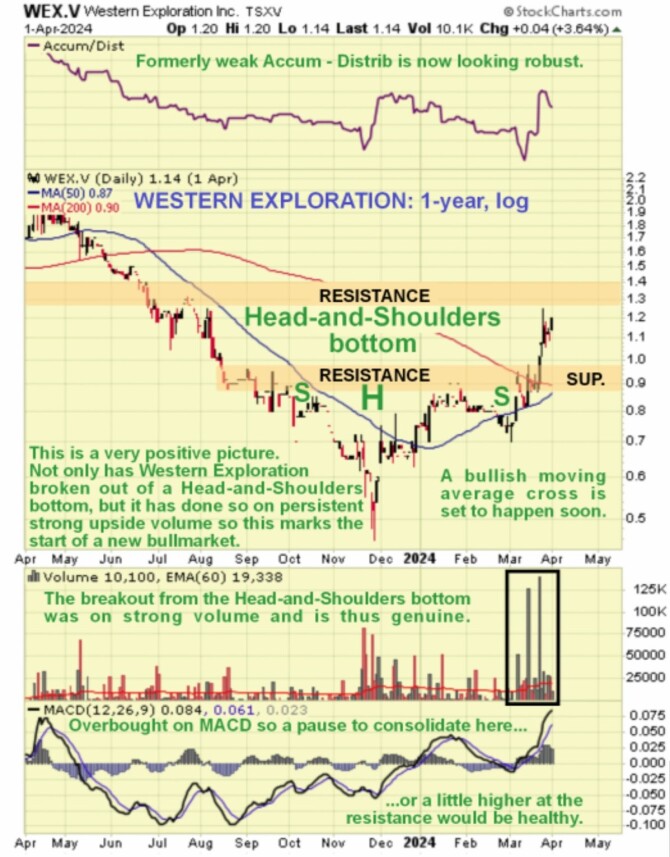
The conclusion is that, with a major gold bull market now starting to gain traction, Western Exploration is a most attractive junior that should be headed much higher and it is viewed as a Strong Buy here and especially on any near-term minor dips.
Less than a week ago the company announced the closure of a successful funding so this will no longer inhibit appreciation of the stock.
Western Exploration's website.
Western Exploration Inc. (WEX:TSX.V;WEXPF:OTC) closed at CA$1.14, $0.84 on April 1, 2024.
Want to be the first to know about interesting Gold investment ideas? Sign up to receive the FREE Streetwise Reports' newsletter.
Subscribe
Important Disclosures:
- Western Exploration Inc. is a billboard sponsor of Streetwise Reports and pays SWR a monthly sponsorship fee between US$4,000 and US$5,000. In addition, Western Exploration Inc. has a consulting relationship with an affiliate of Streetwise Reports, and pays a monthly consulting fee between US$8,000 and US$20,000. For this article, the Company has paid Street Smart, an affiliate of Streetwise Reports, US$1,500 in addition to the monthly consulting fee.
- As of the date of this article, officers and/or employees of Streetwise Reports LLC (including members of their household) own securities of Western Exploration Inc.
- Author Certification and Compensation: [Clive Maund of clivemaund.com] was retained and compensated as an independent contractor by Street Smart to write this article. Mr. Maund is a technical analyst who analyzes historical trading data and he received his UK Technical Analysts’ Diploma in 1989. The recommendations and opinions expressed in this content reflect the personal, independent, and objective views of the author regarding any and all of the companies discussed. No part of the compensation received by the author was, is, or will be directly or indirectly tied to the specific recommendations or views expressed.
- Statements and opinions expressed are the opinions of the author and not of Streetwise Reports, Street Smart, or their officers. The author is wholly responsible for the accuracy of the statements. Streetwise Reports requires contributing authors to disclose any shareholdings in, or economic relationships with, companies that they write about. Any disclosures from the author can be found below. Streetwise Reports relies upon the authors to accurately provide this information and Streetwise Reports has no means of verifying its accuracy.
- This article does not constitute investment advice and is not a solicitation for any investment. Streetwise Reports does not render general or specific investment advice and the information on Streetwise Reports should not be considered a recommendation to buy or sell any security. Each reader is encouraged to consult with his or her personal financial adviser and perform their own comprehensive investment research. By opening this page, each reader accepts and agrees to Streetwise Reports' terms of use and full legal disclaimer. Streetwise Reports does not endorse or recommend the business, products, services or securities of any company.
For additional disclosures, please click here.
Clivemaund.com Disclosures
The above represents the opinion and analysis of Mr. Maund, based on data available to him, at the time of writing. Mr. Maund's opinions are his own, and are not a recommendation or an offer to buy or sell securities. As trading and investing in any financial markets may involve serious risk of loss, Mr. Maund recommends that you consult with a qualified investment advisor, one licensed by appropriate regulatory agencies in your legal jurisdiction, and do your own due diligence and research when making any kind of a transaction with financial ramifications. Although a qualified and experienced stock market analyst, Clive Maund is not a Registered Securities Advisor. Therefore Mr. Maund's opinions on the market and stocks cannot be construed as a recommendation or solicitation to buy and sell securities.


