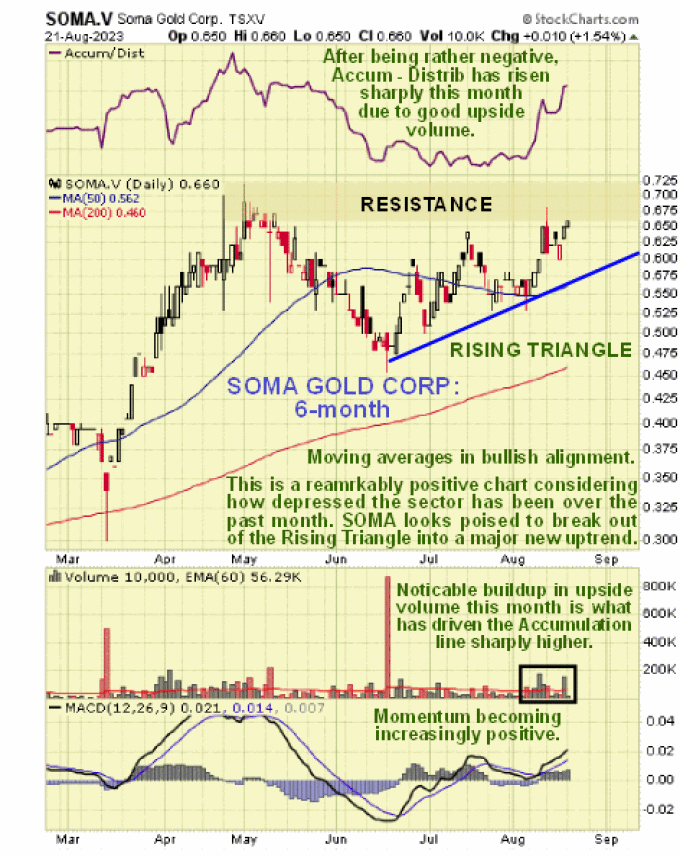
Soma Gold Corp. (SMAGF:OTCMKTS;SOMA:TSXV) has shown great relative strength in recent weeks compared to the sector as a whole, which has fallen back quite hard over the past month.
On its latest 6-month chart, we can see that it appears to be readying to break out of a large bullish Rising Triangle whose upper boundary is the resistance zone associated with the highs of last April / May.
There has been good upside volume in recent weeks that has driven the Accumulation line quite steeply higher. Moving averages are in bullish alignment, and momentum (MACD) is becoming increasingly positive, so it looks like it i son for a breakout above this resistance soon, especially as the sector is looking poised to turn higher after its recent drop (silver broke higher yesterday)

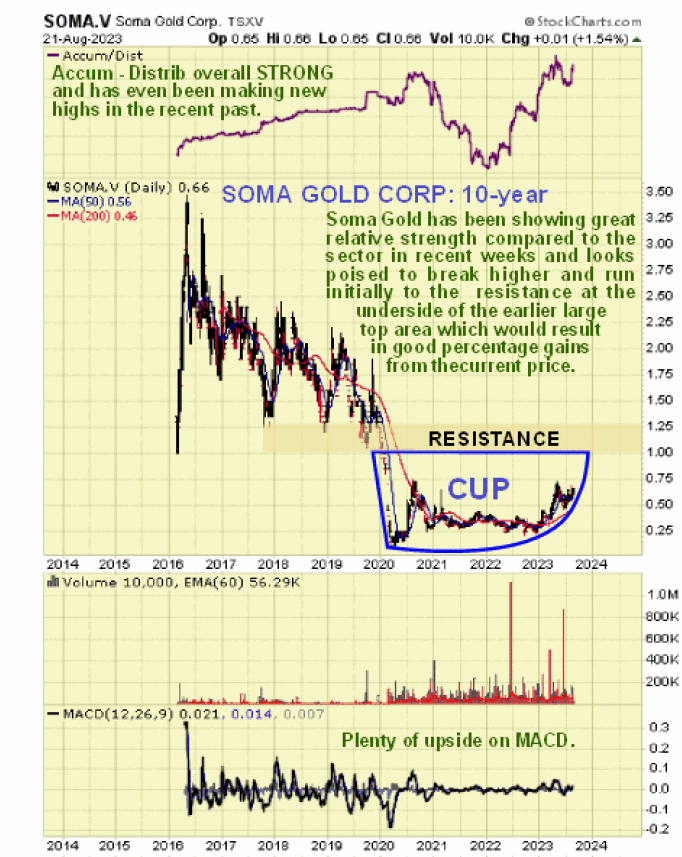
On the long-term 10-year chart, Soma looks like it is advancing to complete the right side of a large Cup base. There is a zone of fairly strong resistance at and above CA$1.00, which arises from potential sellers who got hung up in the large top area that formed before the plunge early in 2020.
So if the price succeeds as expected in breaking out of the Rising Triangle that we looked at on the 6-month chart, it will be free to run quite swiftly up to this resistance, which would result in good percentage gains from the current price.

Soma Gold is therefore rated an Immediate Speculative Buy here. The stock trades in light but acceptable volumes on the US OTC market, and there are approx. 91 million shares in issue.
Soma Gold Corp.'s website.
Soma Gold Corp. closed at CA$0.66, $0.485 on August 21, 2023.
Posted at 9.35 am EDT on 22nd August 23.


