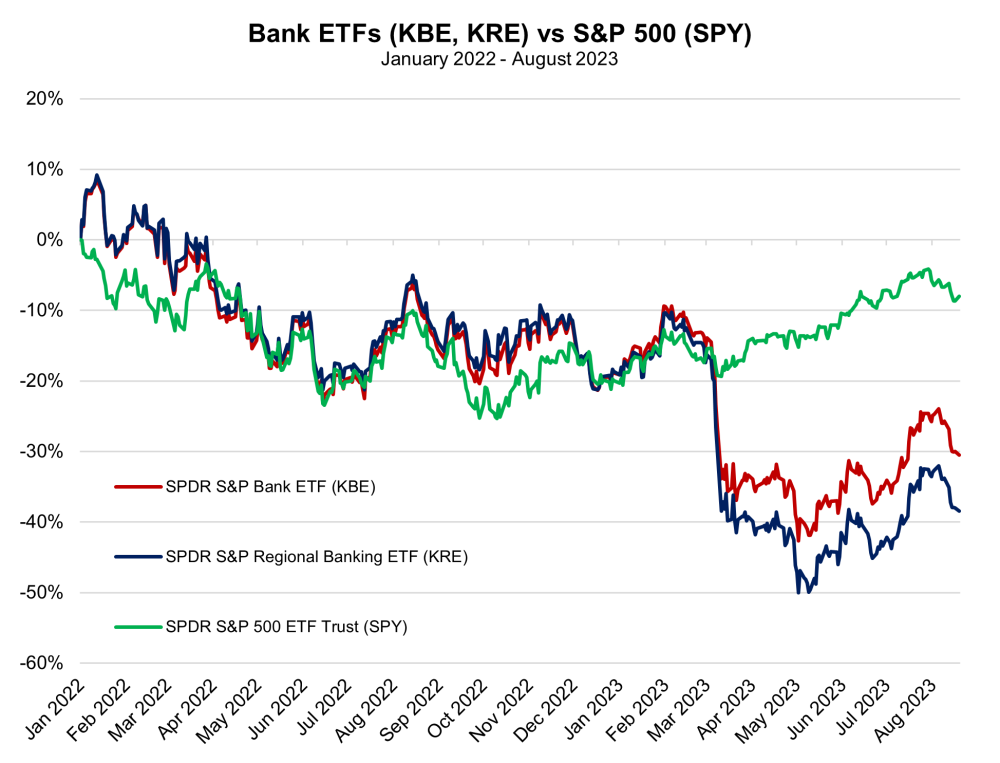
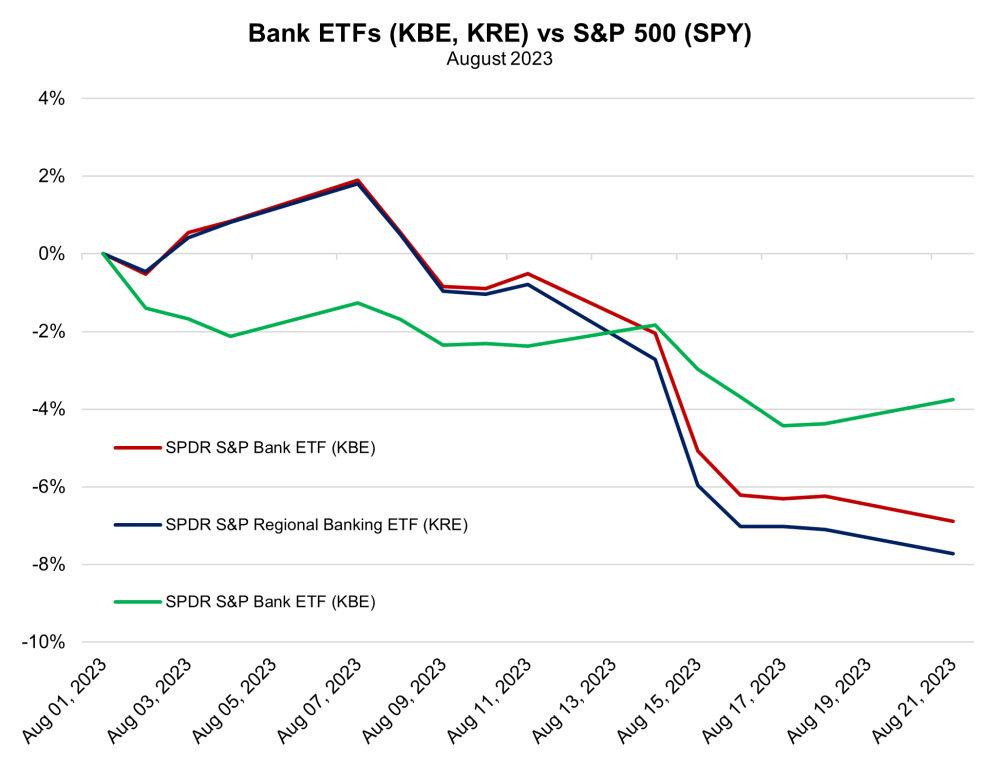
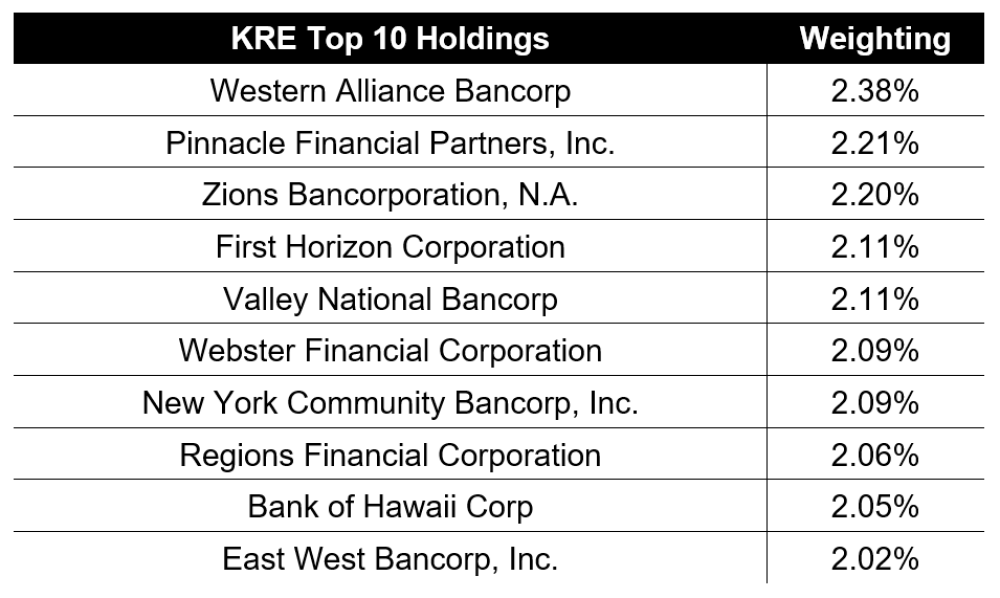
S&P Global Ratings downgraded five U.S. banks by one notch and cut its outlook for two more. Those adjustments follow a similar move by fellow big-three ratings agency Moody's, which MRP covered in detail earlier this month. The largest and most recognizable name on the list of downgraded banks was KeyCorp, the bank holding company and parent to KeyBank, which controlled nearly US$192.8 billion in consolidated assets at the end of Q2.
The other four banks were composed of several other recognizable regional banks, including Comerica Inc., Valley National Bancorp, UMB Financial Corp., and Associated Banc-Corp, ranging in size from about US$40.1 billion to US$90.9 billion. The sum of these banks' assets was equivalent to roughly US$426.7 billion — a smaller total than the more than US$560.0 billion held by the banks that Moody's downgraded. Only one bank, Associated Banc-Corp, was downgraded by both agencies.
The two banks hit with diminished outlooks last night, S&T Bank and River City Bank, were significantly smaller than the downgraded depositories, with each carrying less than US$10.0 billion in consolidated assets. However, S&P Global did reaffirm a negative outlook for Zions Bancorp, which is only slightly smaller than Comerica at US$87.2 billion in assets. S&P's press release on Zions cites a "reliance on higher-cost funding has led to a meaningful decline in net interest margins (NIMs)," which is exactly the kind of pressure MRP has repeatedly cited as a potential curb on banks' financial performance.
In regard to KeyCorp's downgrade, S&P wrote that Key's NIM contracted by 35bps sequentially, to 2.12% in the second quarter of 2023, due to higher funding costs. That followed a 26bps decline in the first quarter. Though that is a particularly steep decline, KeyCorp is not alone in feeling the squeeze on its margins, as BankRegData.com shows the NIM of all U.S. banks has thinned in both quarters of 2023 thus far.
Funding costs for U.S. banks have risen sharply in the wake of a deposit exodus. For years, the industry binged on waves of deposit inflows that usually demanded little to no interest payments. That meant the most accessible funding for banks' lending operations were nearly free. However, as short-term rates on cash-equivalent U.S. Treasury bills have continually surged to multi-decade highs, banks are forced to compete with those securities, as well as lucrative money market funds, that are sucking cash out of banks not willing (or able) to increase their deposit rates to sufficiently stave off outflows.
The amount of assets invested in money market funds has risen to all-time highs near US$6.0 trillion recently. Crane Data's index of the average yield on 100 of the largest money-market funds recently rose to 5.15%, a series high. While Crane's data only goes back to 2006, Peter Crane, president and publisher of Crane Data, told Axios that "It's likely the highest yields since 1999."
Since peaking in April 2022, the U.S. banking sector saw total deposits at all commercial banks decline by as much as -$981.0 billion. Since that trough, only about 11.3% of withdrawn deposits have returned to the banking system. This dearth of deposits has forced banks to seek out alternative means of funding to keep shareholders happy and support their lending operations. Many banks have been leaning on brokered deposits and liquidity from the Federal Home Loan Banks (FHLBs) and Federal Reserve facilities to maintain stability.
The value of the funds on loan from the Fed's Bank Term Funding Program jumped to a record high of more than US$107.2 billion in the week to August 16, up by almost 23.5% over the past three months. The BTFP allows banks to take advances from the Federal Reserve as a loan for up to a year by pledging their underperforming Treasuries, mortgage-backed bonds, and other discounted debt as collateral at par value.
Not only is the liquidity significantly more valuable than the collateral backing it, but it is also very expensive for banks, with the most recent effective rate of that debt coming in at 5.50%. When the BTFP was established, the U.S. Treasury Department pledged to backstop the program with US$25 billion, but its current level of lending is doling out more than 4x that amount.
As MRP noted earlier this month, the rise in BTFP borrowing has helped to partially offset some of the decline that was witnessed in banks' reliance on 11 government-sponsored wholesale regional lenders known collectively as the Federal Home Loan Banks (FHLB). The Financial Times writes that U.S. banks and credit unions had US$880 billion in outstanding loans at the end of June from the entities, down roughly -$120 billion from an all-time high just north of US$1 trillion in Q1, but the increase in BTFP lending over that same period was equivalent to almost US$38.7 billion.
That cuts the net decline in reliance on government financing (excluding credit extended through the discount window and lending to bridge banks) to less than -$81.3 billion. Much like the interest on BTFP loans, the one-year rate on a regular fixed-rate advance from the Boston FHLB is currently equivalent to 5.56%. Commercial banks also appear to be turning to private sources of funding, such as brokered deposits, a high-interest account sold to a bank by a third-party broker. The Wall Street Journal notes that brokered and other time deposits made up 8.5% of total deposits in the second quarter versus 7.2% in the first. In last night's press release, S&P noted that brokered deposits at Zions increased by more than US$8 billion QoQ in the second quarter.
The rush for deposit funding has been a product of surging interest rates, saddling banks with over -$515.0 billion in unrealized losses on large holdings of long-dated Treasuries and mortgage-backed securities, acquired when interest rates were much lower than they are today (and bond prices much higher). Just yesterday, the yield on the 10-year U.S. Treasury note shot to a 16-year high of nearly 4.37%, far exceeding the previous 2023 highs from March, which played a role in kicking off the second, third, and fourth largest bank failures in US history. The yield on the 30-year rose to a 12-year high yesterday at 4.47%.
Though that rise will likely continue to exacerbate the unrealized losses on many banks' Treasury and mortgage bond portfolios, it has managed to help repair the dynamics of banks' lending business by steepening the yield curve. Banks have essentially been flipped on their heads by the inversion of the yield curve, as these institutions borrow money at the short end of the curve and lend at the long end. When rates at the short end of the curve are higher than those at the long end, which has been the case since last year, the profitability of their loan portfolio may struggle to offset the costs associated with funding. Due to rising confidence that the U.S. economy will avoid a recession, the inversion of the 10-year and 3-month yield has been cut from a record -1.89% in June to -1.23% in the most recent week of data.
Charts


| Want to be the first to know about interesting Special Situations investment ideas? Sign up to receive the FREE Streetwise Reports' newsletter. | Subscribe |
Important Disclosures:
- Statements and opinions expressed are the opinions of the author and not of Streetwise Reports or its officers. The author is wholly responsible for the validity of the statements. The author was not paid by Streetwise Reports for this article. Streetwise Reports was not paid by the author to publish or syndicate this article. Streetwise Reports requires contributing authors to disclose any shareholdings in, or economic relationships with, companies that they write about. Streetwise Reports relies upon the authors to accurately provide this information and Streetwise Reports has no means of verifying its accuracy.
- This article does not constitute investment advice. Each reader is encouraged to consult with his or her individual financial professional and any action a reader takes as a result of information presented here is his or her own responsibility. By opening this page, each reader accepts and agrees to Streetwise Reports' terms of use and full legal disclaimer. This article is not a solicitation for investment. Streetwise Reports does not render general or specific investment advice and the information on Streetwise Reports should not be considered a recommendation to buy or sell any security. Streetwise Reports does not endorse or recommend the business, products, services or securities of any company mentioned on Streetwise Reports.
For additional disclosures, please click here.
McAlinden Research Partners Disclosures
This report has been prepared solely for informational purposes and is not an offer to buy/sell/endorse or a solicitation of an offer to buy/sell/endorse Interests or any other security or instrument or to participate in any trading or investment strategy. No representation or warranty (express or implied) is made or can be given with respect to the sequence, accuracy, completeness, or timeliness of the information in this Report. Unless otherwise noted, all information is sourced from public data.
McAlinden Research Partners is a division of Catalpa Capital Advisors, LLC (CCA), a Registered Investment Advisor. References to specific securities, asset classes and financial markets discussed herein are for illustrative purposes only and should not be interpreted as recommendations to purchase or sell such securities. CCA, MRP, employees and direct affiliates of the firm may or may not own any of the securities mentioned in the report at the time of publication.


