

Three Sixty Solar is an interesting company that makes vertical solar structures which make much more efficient use of land area in solar power generation. Both fundamentally and technically the stock is looking most attractive here.
Fundamentally, if we do some digging around, we find that back on the 19th December, the company made a marketing payment of US$382,498 to Creative Direct Marketing Group Inc. which appears to have been a worthwhile investment for a few weeks later the price of the stock almost doubled, with interest in the company and the stock ballooning. As interest then waned the stock went on to lose all the gains. However, on 27th February, the company made a further much larger payment of US$955, 777 to the same marketing company for promotional activity that will occur by print, e-mail and social media during the first and second quarter of 2023 and as we will now proceed to see on the charts, this promotional activity is clearing starting to have an effect.
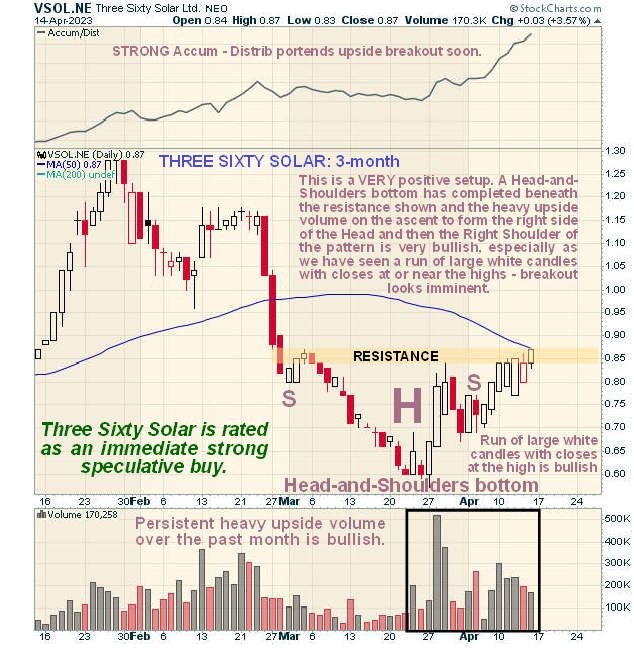
We will start by looking at the 3-month chart so that we can examine the base pattern that has formed since late February in detail, that now appears to be complete. This base pattern is clearly a Head-and-Shoulders bottom that has been accompanied by an exceptionally bullish volume pattern. The ascent to form the right side of the Head of the pattern was on very heavy record volume and we have seen persistent heavy volume again as it has risen over the past couple of weeks to complete the Right Shoulder of the pattern with an unusual chain of bullish “belt hold” candles forming over the past week or so – small wonder then that the Accumulation line, shown at the top of the chart, has been soaring. In recent days the price has been consolidating just beneath the breakout point at the upper boundary of the pattern, waiting for the falling 50-day moving average to drop down to meet it, and now that it has, breakout appears to be imminent. Breakout should lead to a rapid ascent initially to the January high near to C$1.30 where there is of course some resistance.
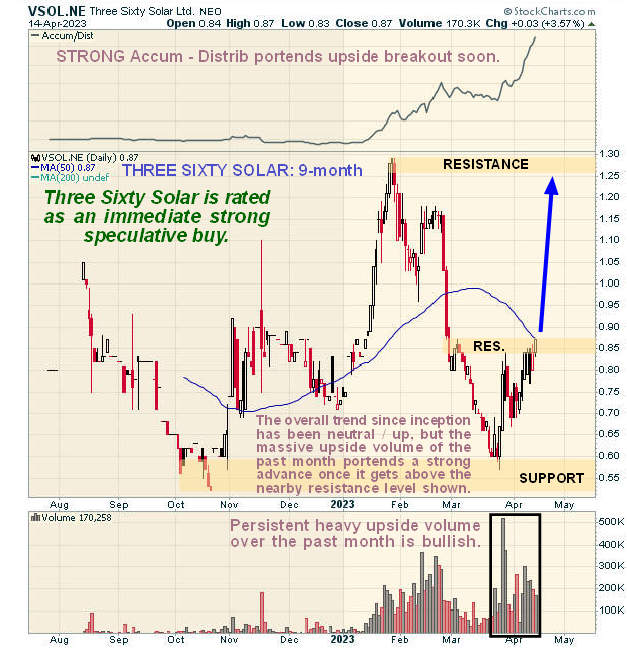
The longer-term 9-month chart enables us to see the entire history of the stock from inception and on this chart we see that the broad overall trend has been neutral to slightly higher. The massive upside volume of the past month, doubtless due in large part to the marketing campaign, portends a breakout above nearby resistance leading to a strong advance, and why shouldn’t it, given that the company has “got the goods” in the form of its unique vertical space saving solar structures? The capacity of the stock to make sizeable gains from here should be assisted by the fact that there are still only about 25 million shares in issue.
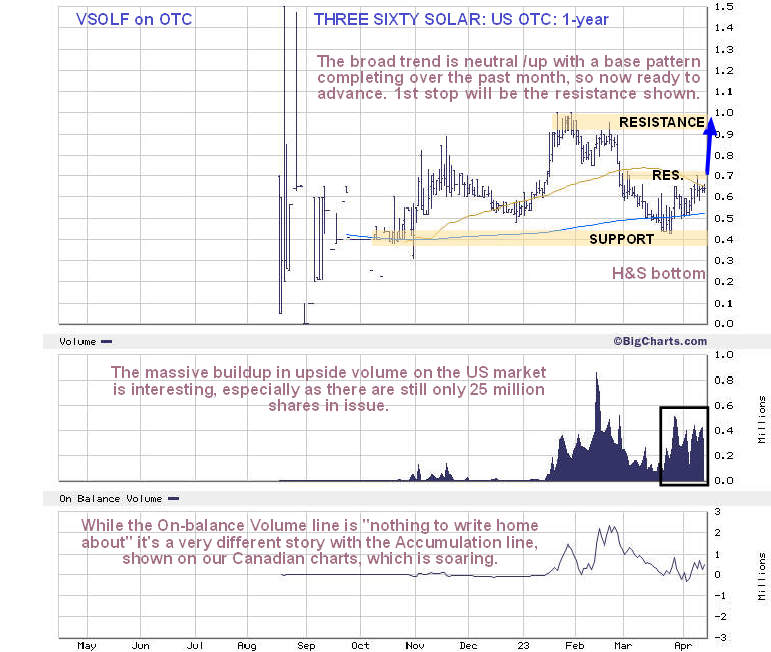
For the benefit of US subscribers it’s worth us taking a quick look at the chart for the OTC traded stock, where the main point to note is that it is now very liquid with good trading volumes. On this chart we can also see the favorable alignment of moving averages with the rising 200-day coming into play to support the price. Although the On-balance Volume line looks rather uninspiring, the Accumulation line on the Canadian charts looks very strong as we have already noted, and this is considered to be more important.
The conclusion must be that Three Sixty Solar is an immediate strong speculative buy here for all timeframes. Anyone taking profits in Arizona Silver Exploration this morning as per yesterday’s update might consider this as a worthwhile destination for all or part of the freed funds.
Three Sixty Solar website
Three Sixty Solar Ltd, VSOL.CSX, VSOLF on OTC, closed at C$0.97, $0.642 on 14th April 23.Posted at 8.40 am EDT on 17th April 23.


