

Silver has three irresistable attributes at this time, one is that it is very cheap historically, especially when you factor in mounting inflation in recent times. Another is that, in common with metals generally, it looks set to enter a robust bullmarket as the dollar breaks down into a severe bearmarket. The arguments relating to why the dollar looks set to break down have been set out in the parallel Gold Market update, as have the other circumstantial factors supportive of a rising silver price, such as the upside breakouts by copper and oil, so they will not be repeated here. The third reason is that, as a tangible asset having intrinsic value, silver will hold its value and increase in price like gold, as inflation mounts in the direction of hyperinflation and it is more practical than gold for everyday barter in situations where you have to exchange something of value to obtain what you need rather than trying to pass off piles of worthless banknotes.
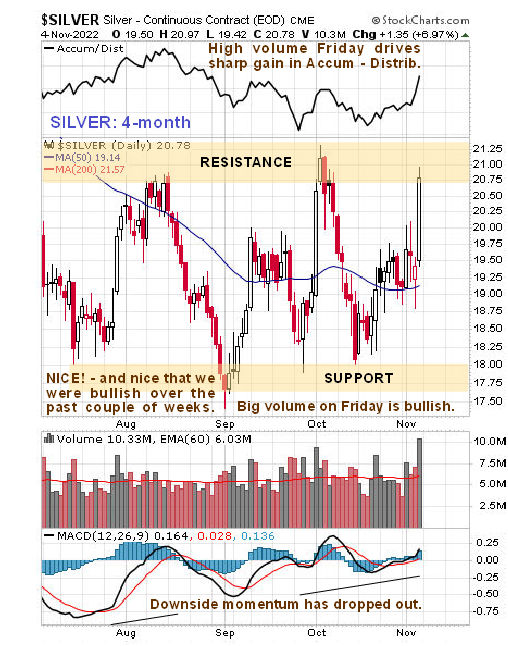
On silver’s latest 4-month chart we can see the large white candle that formed on Friday on strong volume and drove the Accumulation line sharply higher which is a positive sign. This move, which coincided with a large gain by gold and a heavy drop in the dollar, brought the price up into resistance at the upper boundary of the recent trading range.
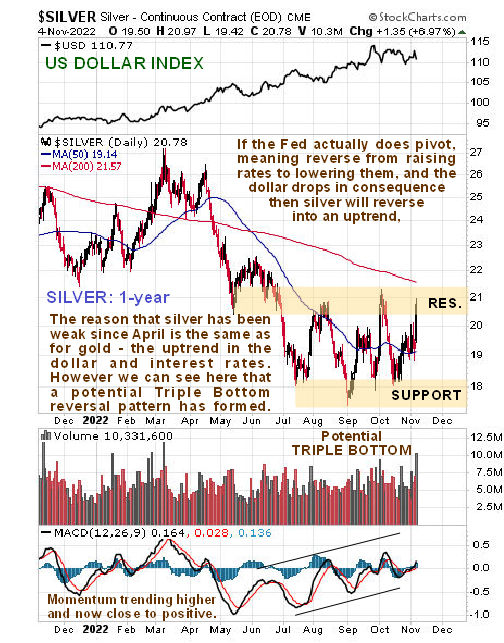
On the 1-year silver chart we can see how the price dropped back in the Summer. The breach of the support in the $22 area was somewhat surprising but was due to a combination of a strongly rising dollar, shown at the top of this chart, with a trend of rising rates in the US. However, since mid-July the price has marked out a base pattern that approximates to a Head-and-Shoulders bottom or Triple Bottom and the duration of this pattern has allowed time for the 200-day moving average to drop down closer to the price and for downside momentum to drop out as shown by the MACD indicator, making it more likely that a rally will develop and it should be noted that if such a rally develops as a result of the dollar breaking down from its parabolic uptrend it could be a scorcher that makes light of overhead resistance.
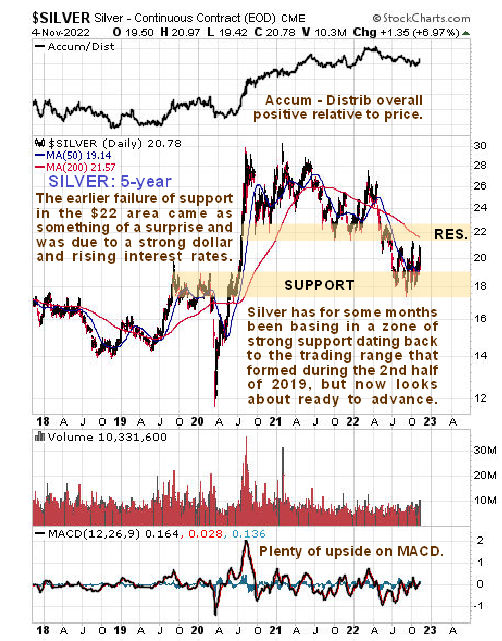
On the 5-year chart we can see why the price found support in the $18 area and has been basing there – this support arises from the considerable amount of trading that occurred in the $17 - $19 zone during the 2nd half of 2019 and early in 2020. So this is a good place for silver to turn higher, especially as the dollar is looking increasingly vulnerable to a breakdown.
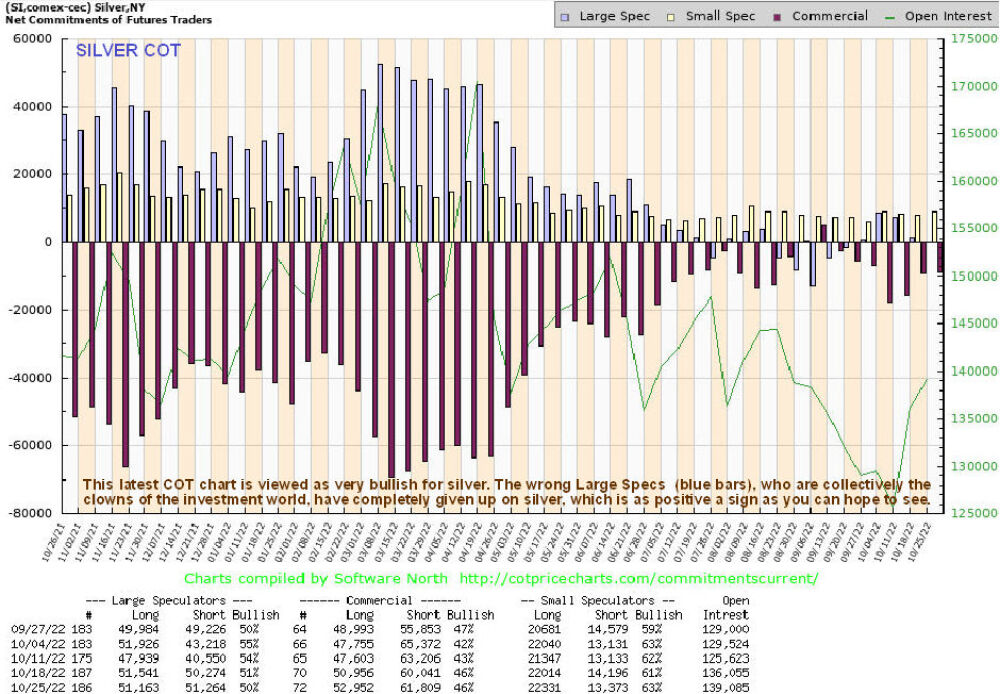
If silver is close to an optimum point to buy then we would expect to see the dumb Large Specs having no interest in it all, and that is exactly what we see on silver’s latest COT chart which shows the Large Specs net long positions to be virtually non-existent…
The conclusion is clear and simple – this is a great place to load up on silver and silver investments, many of which have been severely trampled down, as it is considered unlikely that they will remain at these depressed levels for much longer.


