
A year ago, there were many predictions that the majority of mediocre junior exploration companies would de-list or die off. Observers at the time noted that companies simply did not have enough cash left to create much shareholder value.
It was also apparent that very few of these same companies would be able to raise money in the future in any meaningful way, even to just keep the lights on.
Looking at the data we have today, it's clear we've reached a new level of separation between the wheat and the chaff. While it took longer than expected, this "Great Divide" makes it obvious as to which companies should be avoided by retail investors. In addition, it also helps shed light on the real companies that have a chance at locating the next monster deposit.
We see this as separation as a good thing as it can help create a rallying point for money going into the sector. Instead of trying to score a home run with battered companies, investors trying to play the bottom can start by getting behind some of the companies that have survived the downturn and have continued to perform.
At the very least, this inequality is a sign that we are getting closer to a recovery as all of the waste gets cleansed from the system. In the best case, it means the wheels are greased to start spinning for the whole industry again.
Today, I'm going to point out a couple of jurisdictions that we cover to give clear examples of what I am talking about.
Ontario Exploration
The first place I really noticed an anomaly was in our Ontario exploration dataset. Using our Tickerscores system, which rates companies independently on 20+ variables to come up with a universal investing score, I noticed a company that jumped up the company rankings significantly on only a $300,000 raise.
I thought that made no sense. $300k is not enough money to make a difference in generating some sort of shareholder returnit is typically an amount that is just to keep the company alive and pay the bills with most expenses going towards G&A.
Yet, the reason it made a difference was because all of the other companies in the same jurisdiction were struggling so much. This separation enabled the aforementioned company to bizarrely jump up from 18th to 4th place in our overall rankings for Ontario exploration companies.
So, I decided to dive deeper into the data. Here's the distribution of cash levels of exploration companies in Ontario.
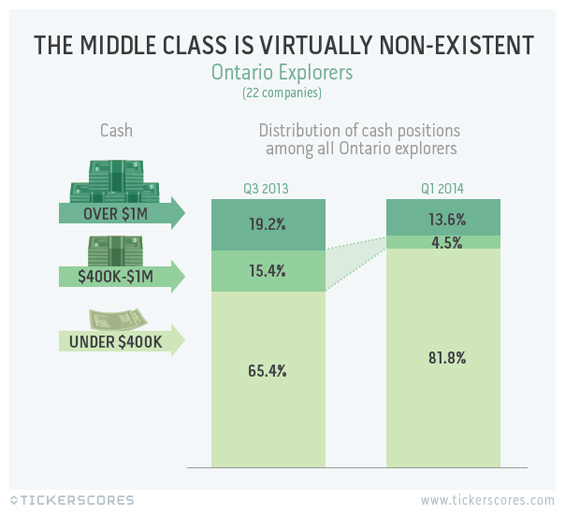
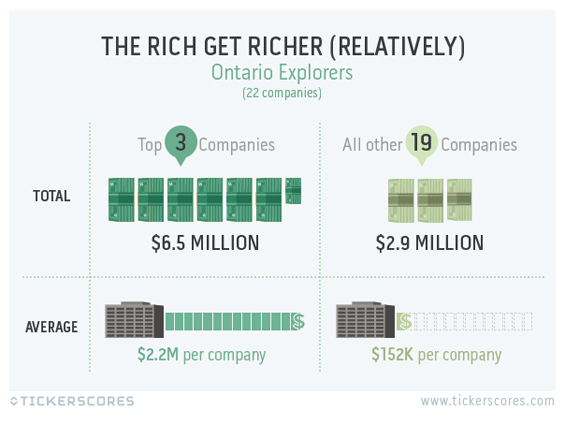
Or to put it another way, 19 of 22 companies in total have less than half the cash of the top three.
Note: it's worth mentioning that we define the "exploration stage" as companies without a valid 43-101 resource.
There are some other indicators as well. Those top 3 companies that rate the highest in our system in Ontario exploration have an average G&A expense ratio of 26%. This is a healthy ratio that has plenty of cash going in the ground. The other 19 companies? They average a less stellar 76% G&A. For every $1 they raise, $0.76 is paying management salaries, rent, and other such costs. It's no wonder the rich get richer (relatively).
Nevada Exploration
Let's tune into exploration in Nevada. What was a jurisdiction with 19 companies in Q3 of '13 is now just 16 companies. Evolving Gold (EVG.TO) was delisted from the TSX, and two companies "shifted focus" to properties in other regions.
This shift is a little different from Ontario exploration, but still very apparent.
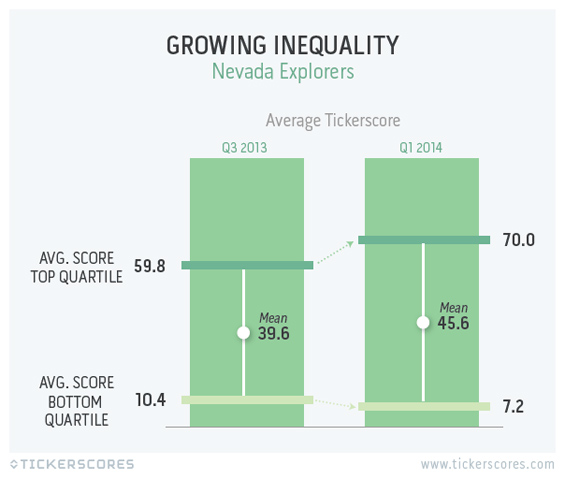
Here, the gap between our highest and poorest scoring companies widens with more inequality than we have ever seen. Over six months, the top quartile jumped an average of +17.0% in score. Meanwhile, our poorest scorers dropped an average of -30.3%.
Same goes for cash and G&A, as two example metrics. The best companies had their average G&A barely change from 39.9% to 40%. Meanwhile the poorest went from 90% to 94%.
On the cash front, the top scorers did drop from $3.4m to $2.6m, but the poor scorers dropped much more significantly on a percentage base. They averaged $108k six months ago and now average a paltry $31k cash position. These bottom tier companies are low on funds, cannot raise, and many have already tried rolling back. Some of these companies have less than your average paycheque in the bank and will be delisted soon. (Or maybe they will "switch focus" to medical marijuana and attempt a raise?)
Mind the Gap
This inequality in the sector will be the new normal for awhile, as hurting companies move towards bankruptcy or irrelevancy. The beautiful thing is: right now this rift makes it easier to spot which companies have good balance sheets, great management teams, and won't turn on investors even in tough financing conditions.
This is a great opportunity for investors to get into some quality names, especially at the tail of the summer doldrums.
Jeff Desjardins
Tickerscores