'Bear Raid' with SPDR Gold Sales
After all the fall in the gold price was hard and fast due entirely to the bear raid in the U.S. This started in mid-April after the sales from the SPDR gold ETF had begun more than a month ahead of that. The signal for the bear raid was given when Goldman Sachs issued a recommendation to their clients to go "short" of gold. The fall was very dramatic and shook the gold world to its roots. The volumes of physical gold that were sold were enormous. Even the Central Bank Gold Agreement limitations on gold sales (when they occurred, pre-2009) were held at 4 500 tonnes a year. These sales took place over three months, with the 500 tonne bear raid happening in one week.
COMEX warehouse reductions [200 tonnes]
Banks plus hedge funds sales [at over 300 tonnes]
Plus the heavy sales of gold from the SPDR gold ETF [at over 500 tonnes]
We estimate total U.S. gold sales at over 1,000 tonnes over the last four months. This saw prices fall from the upper $1,600 to $1,200 recently. This gold was bought up primarily by countries east of Greece through to China.
Reaction
It would be extremely naïve of any investor to believe that the current gold prices are now set in stone. As the low prices in the $1,200 region were reached, physical demand was very high, globally, but particularly from Asia. These have petered out as low prices have persisted, but buyers are now in the wings waiting for a "floor" price to be established first.
But the fall in the gold price changed the entire dynamics of the gold market.
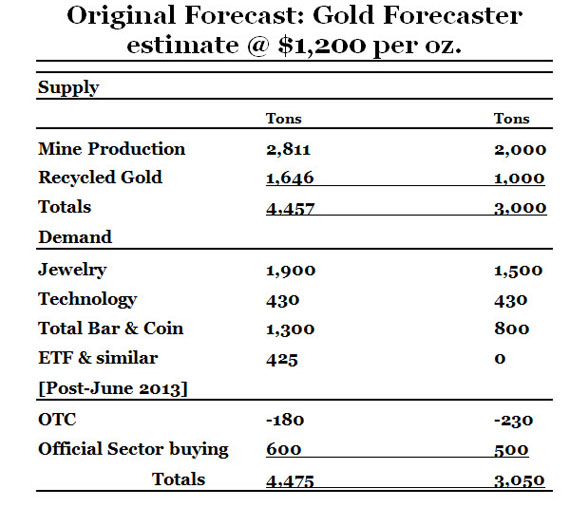
Before we give you these figures we will explain just how we have to distort the numbers to make them fit the impact of falling supply. To this end, we have gone against the obvious impact of lower prices and reduced demand in sectors where we know demand is bound to rise. Here's our thinking behind the squeezing of demand into prospective supply. We do this to highlight how a tremendous price rise is needed to resuscitate newly mined gold volumes and to distill evaporated recycled gold.
Supply
Newly Mined Gold
The falling gold price is hitting the mining equity sector extremely hard at the moment, but this will reinforce our view that the fall in the gold price is temporary.
The decision by Newcrest Mining Ltd. (NCM), Australia's biggest producer, to write down the value of its mines by as much as A$6 billion ($5.5 billion), will lead to the biggest one-time charge in gold mining history. Rivals such as Barrick Gold Corp. (ABX), the biggest producer, and Newmont Mining Corp. (NEM) are expected to be next.
The unfortunate "Junior" sector of gold mining is being savaged, with projects cancelled, mines going bust, but those able to survive for the rest of this year falling in price to levels that we believe will be absolute bargains in the months and years to come. Once the reality of the price falls feeds through to supply and demand numbers, we see share prices recovering very strongly. But today's reality was well expressed by Nick Holland, CEO of Gold Fields, in South Africa.
He said, "There's going to be significant rationalizing in the gold industry. You can't keep mines producing if they're losing money. Gold Fields South Deep mine in South Africa is one of the few mines that could survive at the current gold price of 1,230 an ounce. The mine's size [57 million ounces of gold at 3 kilometers and deeper] and the fact that it's largely mechanized, meaning it's less reliant on labor demanding pay rises, will help keep costs low."
But he was definitive when he said that,
Bullion must rise to $1,500 an ounce for the gold mining industry to be sustainable. The industry is not sustainable at $1,230 an ounce, which is where the gold price is at the moment [now falling through $1,200]. We're going to need at least $1,500 an ounce to sustain this industry in any reasonable form.
To illustrate what we mean, we note that 25% of gold mining companies are "underwater" at $1,400. We expect this number to rise to over 50% at $1,200? Those who do survive will follow Newcrest and the rest of the large companies and cut their reserves and raise their grades to levels that make the mines profitable at these prices. The implication is that the supply of newly mined gold could actually halve to 1,400 tonnes per annum? But for the sake of conservatism we only drop supply by 800 tonnes to 2,000 tonnes.
Recycled Gold
The balance of supply comes from sellers of gold, whose sales are evaporating at prices below $1,500. At 1,700 tonnes, scrap sales projected with prices around $1,650, we again underestimate the impact of $1,200 prices and give an optimistic figure of 1,000 tonnes going forward annually. This should leave total annual supply of gold at 2,400 from the projected 4,500 tonnes? But optimistically we hold it at 3,000 tonnes.
What are these? We base our figures on the World Gold Council's estimated figures for 2013 and adjust them in the light of the above events.
Demand
Jewelry: On the demand side, for the sake of this exercise, let's ignore the reality that jewelry demand would soar at these low prices, $1,200 or less per ounce and actually reduce jewelry demand to 1,500 tonnes, down from the projected demand at $1,650 an ounce of 1,900 tonnes. The reality is that we expect several hundred tonnes more jewelry demand at prices of $1,200 an ounce.
Technology: Let's leave the price insensitive Technology demand unchanged at 430 tonnes.
Official sector: Likewise "official sector" demand we leave at slightly lower levels of down from our projected level of 600 tonnes at 500 tonnes.
Total bar & coin: Which has risen strongly this year to date, we reduce (wrongly) to 800 tonnes down from the projected 1300 tonnes.
Gold ETF demand: We reduce to zero down from the projected 425 tonnes.
Thus total demand for the next year unrealistically, pessimistic allowing for 'over-the-counter stock flowsat 3,050 tonnes. As you can see we have to cut demand unrealistically low to match the likely fall in supply to permit gold prices to stay anywhere near today's levels.
Hopefully, this is very useful to you subscribers because it paints a graphic picture of current gold market fundamentals. We've heard from many expert analysts, whose reputation we respect, but we see them as being very wrong-footed on their views that they see a multi-year bear market for gold. We see them as making a mistake on two areas:
1. Demand/supply numbers will prevent this from happening as it implies a huge shrinkage in both.
2. The price fall has been entirely a U.S. sales phenomenon, which is finite. Either the U.S. will remain out of the market going forward or will have to add to the demand figures we have described above. If they add, then gold price estimates will have to be raised significantly.
As investors, you must ask yourselves: At what price can demand be made to reduce to the levels we portray above and at what price will recycled gold supplies rise to cap the gold price and satisfy demand?
So when Nick Holland says prices of $1,500 are needed to sustain the gold mining industry, we think he is right. Please note that he is referring not just to cash costs per ounce produced, but cash costs, plus exploration costs, plus development costs, plus sufficient profit to distribute to shareholders to keep them investing. Cash costs at $1,200 are not the costs that make gold mining sustainable. $1,500 is far closer to the mark of real costs per ounce.
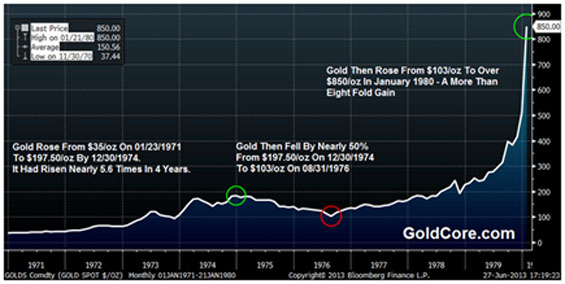
Consequently, when supplies are likely to drop to a level that even the most pessimistic demand levels are not met, we have to be close to a turn in the gold price. We attach an historic gold price chart going back to the early seventies to show the stark reality of what can happen after gold prices were held at unrealistically low levels (thanks to GoldCore.com).
Julian Phillips
Gold Forecaster
Legal Notice / Disclaimer
This document is not and should not be construed as an offer to sell or the solicitation of an offer to purchase or subscribe for any investment. Gold Forecaster - Global Watch / Julian D. W. Phillips / Peter Spina, have based this document on information obtained from sources it believes to be reliable but which it has not independently verified; Gold Forecaster - Global Watch / Julian D. W. Phillips / Peter Spina make no guarantee, representation or warranty and accepts no responsibility or liability as to its accuracy or completeness. Expressions of opinion are those of Gold Forecaster - Global Watch / Julian D. W. Phillips / Peter Spina only and are subject to change without notice. Gold Forecaster - Global Watch / Julian D. W. Phillips / Peter Spina assume no warranty, liability or guarantee for the current relevance, correctness or completeness of any information provided within this Report and will not be held liable for the consequence of reliance upon any opinion or statement contained herein or any omission. Furthermore, we assume no liability for any direct or indirect loss or damage or, in particular, for lost profit, which you may incur as a result of the use and existence of the information, provided within this Report.