Knowing that it's very likely that gold and silver have bottomed, we feel it is time to look at the charts and assess what may or may not be in store over the next year or two.
Gold has consistently made impulsive advances that were digested by multi-quarter corrections and eventually followed by a breakout and new impulsive advance. Following the last major breakout in late 2009, gold enjoyed an extended impulsive advance that lasted two years. Previous impulsive advances lasted less than a year. Gold, having bottomed, remains well entrenched in another consolidation that is 12 months old. As we can see from the chart, previous consolidations lasted 16 to 20 months.
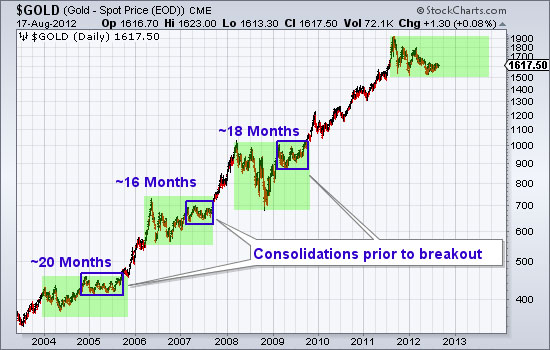
It is important to note that previously gold, within a year was able to rally back near the recent impulsive high. In other words, gold is currently in a much weaker state relative to past consolidations. Gold will need to rally back to $1800 or $1900 and that would be followed by a multi-month consolidation that would lead to a breakout. Conservatively speaking, over the next 12 months we could see a rally back to $1900 and a final consolidation.
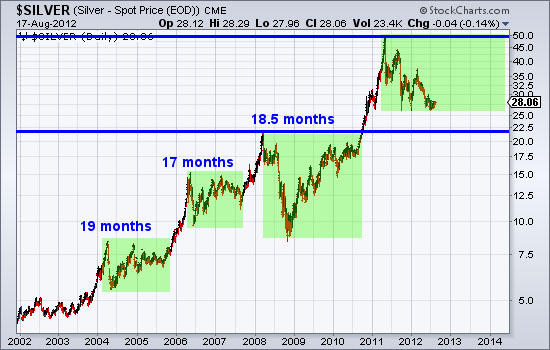
Meanwhile, silver continues to consolidate and digest the two and a half year advance from $8 to $49. Predictions of $60 or $70 silver are absurd and fail to account for the lengthy consolidation that is needed to reduce supply and position the market for not only a retest of $50 but an actual breakout. Silver is a commodity with real world supply and demand dynamics. It will be a while before producers won't sell for $35-$36 and before buyers consider $35 a bargain. That being said, the near and medium term outlook is quite compelling. Longer-term, the market is in a giant cup and handle pattern (dating back to the high in 1980) and this correction and consolidation is the handle. A powerful breakout past $50 in, say 2014, could push silver toward its bubble phase.
The fact that gold and silver are unlikely to break to new highs anytime soon hardly deters me in my bullish enthusiasm for select gold and silver stocks. Key word being select. I'm not bullish on every mining company but I digress. In the chart below I use a 66-day moving average to plot an average quarterly gold and silver price. I also circle the moving average at the end of quarters.
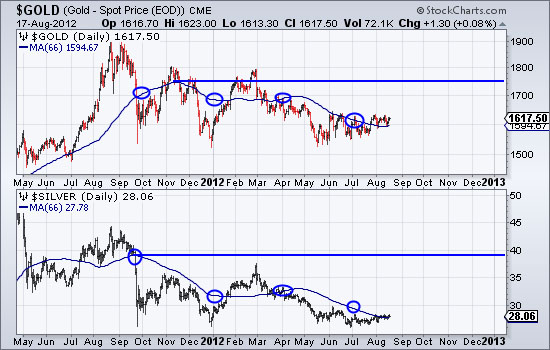
Note that the quarterly high prices for gold and silver are roughly $1750 and $39 and far off from the 2011 highs. The quarterly averages are starting to turn up. Well run companies with production increases could very well move to new highs when gold returns to $1750 and silver moves past $35. We do think most of the gold and silver shares can breakout to new highs ahead of the metals. In other words, the mining shares at large will ultimately challenge for a breakout ahead of gold and silver reaching new all time highs.
Good Luck!
Jordan Roy-Byrne
The Daily Gold


