It's summer time and during this time of year I don't write as many
Gold Reports as I typically do during the rest of year. Nor do I hold as many Live Chatrooms. This is because so many people have their attention turned elsewhere during the summer months.
Since my last report, published nearly 3-weeks ago, not a lot has change. That's not to say a lot isn't going on behind the scenes.
Related Articles:
Equities the Way to Benefit from Gold's Strength: Henk Krasenberg
Euro Debt Crisis is Good for Gold and Silver: Sprott Money Manager Charles Oliver
The People Have Spoken and Precious Metals Will Soar: Leonard Melman
- Iran's stance with the West hasn't changed
- Iranian sanctions have tightened in the last 30-days
- Spain's interest rates have hit new all-time highs of 7.6 in 10-year bonds
- Italy's interest rates have soared to 6.5% for 10-year notes
- German interest rates have declined to a point where investors are paying Germany to hold their overnight funds
- US interest rates are at all-time lows
- The US Federal Reserve is reportedly mulling enacting another round of stimulus as early as next week
As of this morning, gold has once again had a mini upside chart breakout. As I see it the next upside chart target is 1615. I will deem this mini upside breakout a failure if prices get back under 1562.0. Also, until prices close over 1640 basis the August contract, a more serious upside breakout hasn't occurred. In other words the market now has an upside bias, but it's still caught in a trading range of 1640 to 1550. Some might say the downside support is between 1550 and 1530. I fall in that camp.
What's been interesting is that nothing has been able to move gold prices into an uptrend since May. As you'll see on the chart below, price action is coiling in a spring like fashion. This coiling can go on for a very long period of time. Seasonally speaking, gold has entered the second half of the year where prices, at least on a seasonal basis, tend to have upside bias due to factors having little to do with world economies. Christmas orders for gold for jewelry cause some gold buying by retailers now. In other parts of the world, there are factors that generally speaking cause gold to get a bid at this time of year.
As I see it, one of the reason for "today's" mini breakout centers around reports that the Federal Reserve is getting ready to implement another round of stimulus, as early as next week. Gold has shown over the past 6-months that stimulus moves get investors in gold's attention in a positive way. Given that nothing else has so far, it's all that gold has going for it at this time.
In my last report I said that gold was looking for a story to motivate investors to buy gold. It seems to me that potential easing in the US and China is the motivating forces in play at this time.
Iran is always in the background, but until Iran attempts to shut down the Straits of Hormuz or Israel steps up and attacks Iran, the Mideast seems to not be a catalyst for gold.
Seasonal Charts
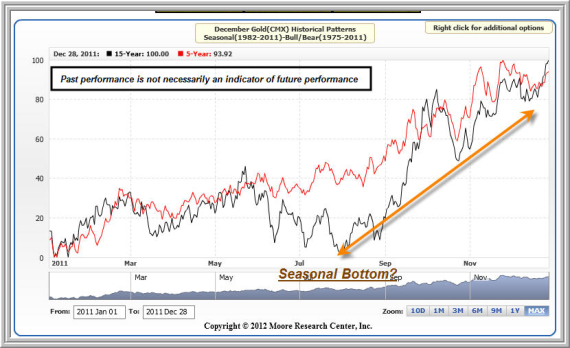
The above chart is published with permission of the Moore Research Center, Inc.
For simplicity purposes, I have published below the 15 and 5-year seasonal patterns. As you can see, they are very similar and show that gold prices tend to decline into July.
Seasonally speaking, gold is doing exactly what it should in terms of rallying right now. This is the time of year that watchers of seasonal patterns look for gold to get bid.
In my last report I was expecting prices to break into early July. They did as expect. Now I am expecting an overall bullish bias into year end. How far that bias might carry prices remains an uknown, but the bullsih bias is in place now.
Monthly Chart
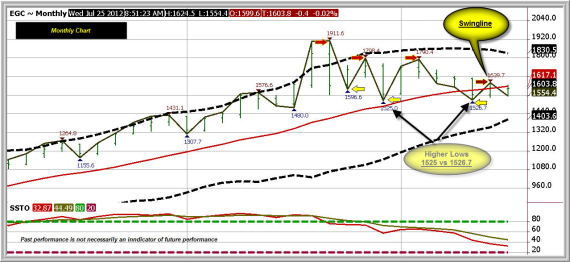
The Monthly chart pattern above is neutral.
The Swingline Study, the continuous black line on the above chart is neutral as the prices have a pattern of higher lows and higher highs. At the time of the publication of this report, prices are trading under the 18-Month Average of Closing Prices, the sold red line, which has a value of 1617.1. Momentum as shown by the Slow Stochastic reading (SSTO) is neutral.
As I mentioned earlier in this report, I see overall resistance at 1640. Look at the last Swingline High on this chart. It is at 1639.7. If it were taken out, the Swingline Study would change to bullish because you would have a chart pattern of higher highs, higher lows and prices at that point would be over the 18-Month Moving Average of Closing Prices.
The black dashed lines, the Bollinger Bands, are also displayed. They provide theoretical support and resistance points. 1920 is the upside target on this chart, if 1639.7 is taken out.
Weekly Chart
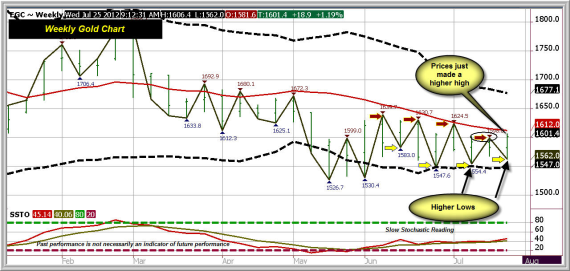
As you can see the Swingline Study just made a higher high today. Highs are (the Red Arrows) and lows are (the Yellow Arrows). This is taking place under the 18-Week Moving Average of Closes, 1612.0 which is this charts first resistance point.
Because the Swingline is up and prices are under the 18-Week Moving Average of Closing Prices, 1612, the trend is neutral.
All this chart needs to do to turn bullish is close over 1612. In the meantime the downtrend on this chart has been neutralized until this week's low is taken out.
This means that both the Monthly and Weekly charts, while not yet bullish, are on the cusp of becoming so.
Daily Chart
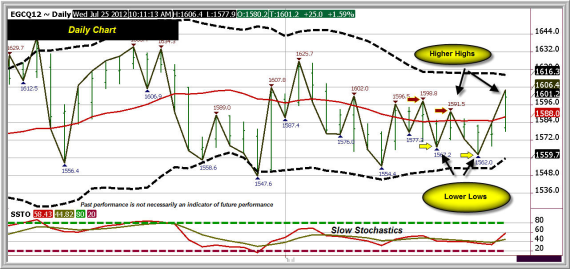
The Swingline Study has turned bullish. Slow Stochastic readings are bullish as well.
Unlike the Monthly or Weekly Charts, the August Gold chart is bullish. The next break in prices, as long as it doesn't take out 1562.0 should confirm the bull trend by establishing a higher low, which would make for a pattern of higher highs and higher lows. The only kink in the armor right now is that the current chart pattern is one of lower lows and higher highs. Because the most recent event was that of making a higher high which took place with prices trading over the 18-Day Moving Average of Close, you should be bullish.
The dashed black line is the Bollinger Band Study. The upside price target is therefore 1616.3, which is very close to the Monthly Chart's 18-Month Moving Average of Closes near 1617. Therefore, the 1616-1617 level is the first serious resistance level.
I am bullish and recommending long positions now.
Summary
It's possible I am early, but I think it time to reach out to buy December Gold. My recommendation is to use the Micro Contracts and add to them if prices prove you to be correct.
As I see it support in December Gold comes in at 1592.0. Initially I would not recommend staying long if prices take out 1561.50. First upside resistance comes in near 1620, with further resistance again seen at 1640. If 1640 is taken out I would expect that the market would sit up and take notice, meaning that prices could move really begin to accelerate after that.
I update actual trade recommendations to my subscribers. Keep in mind that I update my trade recommendations twice daily, if not more. Today I will have a minimum of 4 updates, so keeping up with the twist and turns is important.
Ira Epstein
The Linn Group