Getting back on topic, this report clearly shows how the U.S. dollar plays a dominant role in the price of other investments. Understanding how to read the Dollar Index will make you a better trader all around when trading stocks, ETFs, options or futures.
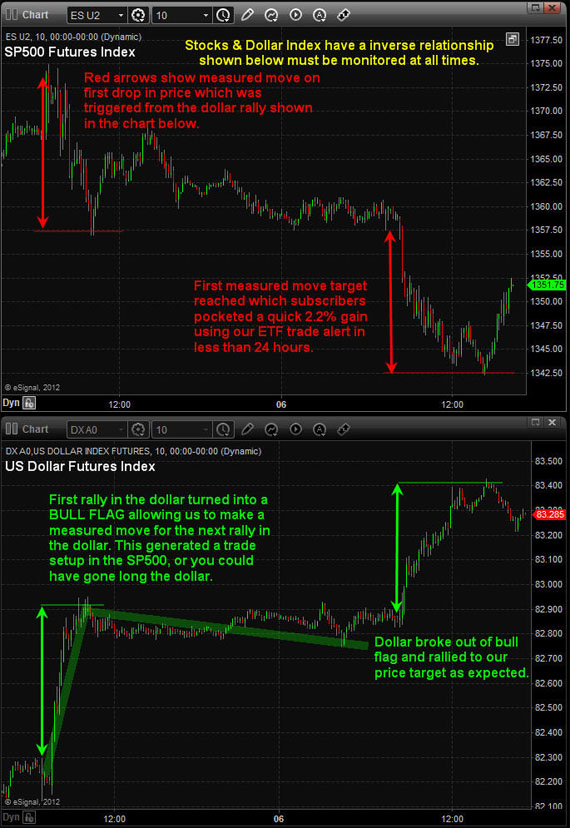
SP500 Stock Market predictions 10 Minute Chart:
These charts clearly show the inverse relationship between the stock market and the dollar index. Knowing how to read charts (candle sticks, chart patterns, volume etc. . .) is not enough to give you a winning edge. You must also understand inter-market analysis as all markets are linked together in some way and the dollar plays a major role in where stock prices will move next. Review the charts and comments below on how I came up with my stock market prediction and trade idea.
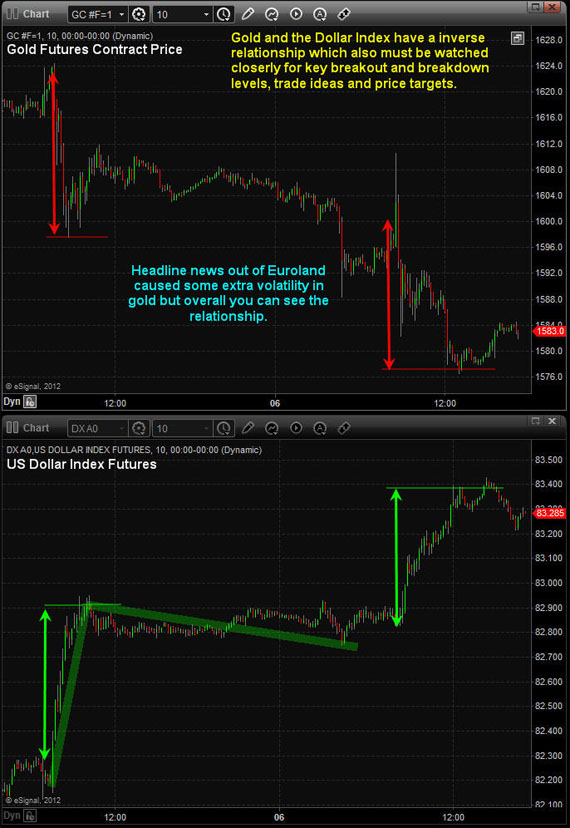
Gold Market Prediction 10 Minute Charts
Gold is another investment that is directly affected by the price of the dollar. Review charts for more details.
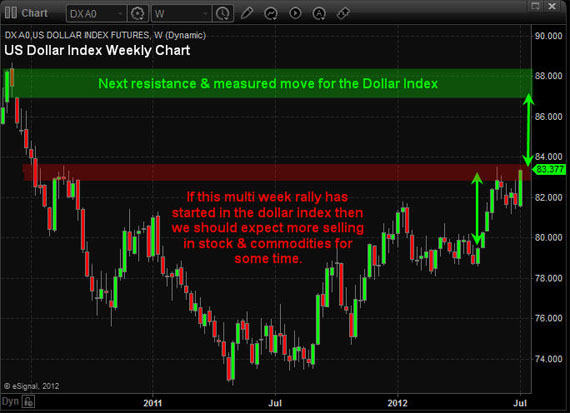
Long Term Stock Market Forecast: The weekly dollar chart is VERY IMPORTANT to watch as a short term trader and long term investor because trend changes in the dollar means you open positions will also likely change direction.
So, if we apply technical analysis to the dollar chart as seen below. You will notice we are able to create a market forecast and predict roughly where price is likely to move and how long it should take to get there. If the dollar can break above the red resistance level then we can expect a rally for 48 weeks and a price target around the 8788 level.
If this is the case then stocks and commodities would likely do the inverse price action and move lower, sharply lower. . .
Stock Market Predictions & Gold Market Forecast Conclusion:
In short, the next weekly candle stick on the dollar chart could be a game changer for those who are long the overall stock market.
I will admit that the current market conditions are not easy to trade because of all the headline news rolling out of Europe each week along with economic data. And I feel as though we have been tip toeing through a mine field for the past 12+ months waiting for extremely negative news are extremely positive news to trigging a wave of buying or selling that will make our jaw drop, but it has yet to happen. Remember, always use stops and dont get over committed in a headline driven market.
Chris Vermeulen
The Gold and Oil Guy