We have previously covered yield curve dynamics, for a refresher the following excerpt should aid in comprehension of this article.
"For those readers who may be unfamiliar with how the yield curve works, we will provide a brief explanation. Bonds of different maturities have different yields. By plotting these yields against their maturities we can build a yield curve. The yield curve becomes steeper if longer-term interest rates increase relative to shorter term interest rates. The yield curve becomes flatter if longer-term interest rates decrease relative to shorter-term interest rates. One way to measure the steepness of the yield curve is to look at the difference between the yields at two different points on the curve. For example, one may look at the difference between the yields on two-year treasuries compared to the yield on five-year treasuries. Such a comparison will often be referred to as '2s5s' and is measured in basis points (bps) by subtracting the shorter-term yield from the longer-term yield. So if one says, '2s5s are trading at +225,' this means that the yield on five-year bonds is 2.25% higher than the yield on two-year bonds. If 2s5s go from +225 to +275, then the yield curve has steepened between those two maturities. If 2s5s go from +225 to +175 then the yield curve has flattened between those two maturities."
Intuitively, one would expect a flattening yield curve to be bullish for gold. Flatter yield curve = economic weakness = safe-haven assets (gold) becoming more valuable, especially if such weakening in the economy is followed by monetary easing, or increased expectations of monetary easing. As with any hypothesis, this one is useless without being tested.
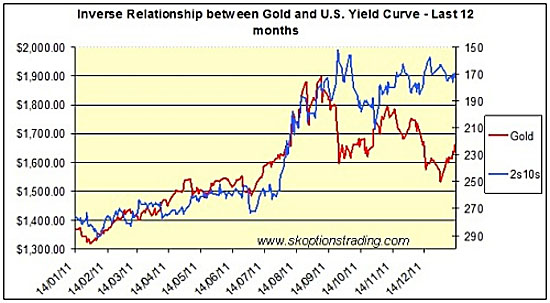
The above graph inversely plots gold against yield curve gradient. The early trend is clearly quite strong (i.e., yield curve flattening and gold rising correspondingly). Around September 2011 the relationship becomes shakier. From September onwards, the trend seems to take a dramatic reversal, switching from negative to positive. Trying to explain this reversal is somewhat a case of speculation. The only thing that can be said with certainty is that other factors are proving more important in determining the gold price.
The graph below plots gold against yield curve steepness rather than time, over the last 12 months.
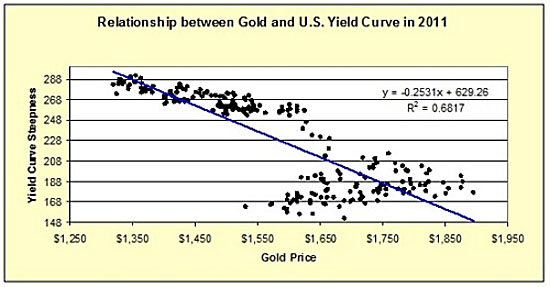
The trend is clear. Gold is driven higher when the yield curve flattens, exactly what one would expect to see. The R2 value shown of 0.6817 means that 68% of the variation in the price of gold can be determined by changing yield curve gradient.
As a trading service, we have a short- to medium-term focus. As a result, the majority of useful information to us is very timely. For this reason the trends and relationships we observe must hold not only over the long term, but the short to medium term also. We cannot afford to wait five years for the market to return to where a certain model says it should be. As a result the plot below showing the trend since September is potentially the most important of this update.
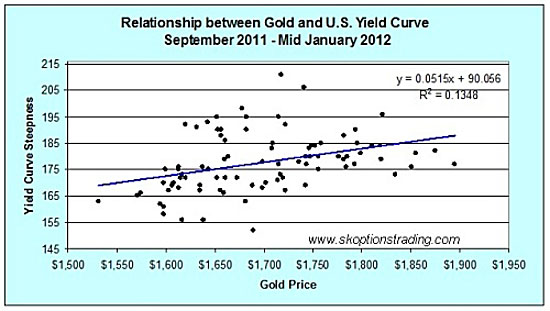
As hinted at, the trend has shifted mildly positive, meaning a steeper yield curve = gold driven higher. However, the relationship is extremely weak (shown by an R2 value of 0.1348) and is too inconclusive for our purposes. The conclusion is that currently there is no relationship between the steepness of the U.S. yield curve and the price of gold. We can safely assume other factors have been significantly more important in the determination of the gold price in recent months.
The correlations for differing time frames over the past four years are as follows:
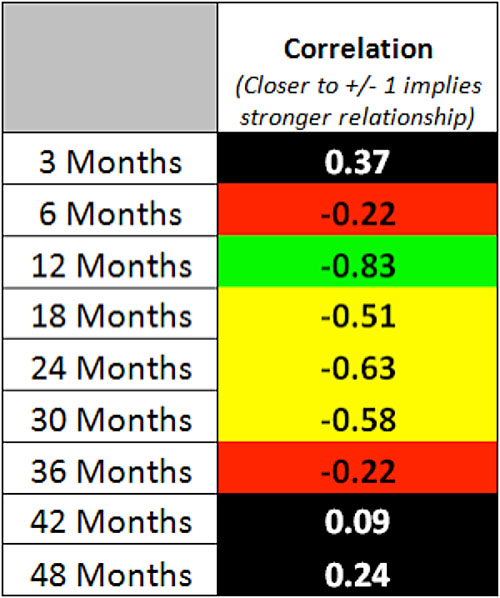
Note: Correlation (r) is not to be confused with the coefficient of determination (R2).
What we can draw from these results is that over the medium term gold exhibits a moderate negative relationship with the gradient of the U.S. yield curve. True to intuition we still believe a flatter yield curve (usually resulting from monetary easing) is a bullish signal for gold.
Imagine that the Fed eased further, causing the yield curve to become flatter still. This is a scenario observable in Japan, a country currently with an extremely flat yield curve resulting from an extensive period of monetary easing. As an example, assume 2s10s drop to 50 basis points. What is this likely to mean for gold? Depending on what model we use the following values are predicted:
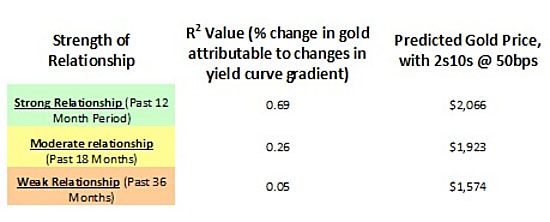
Obviously the most accurate figure depends on one's current assessment of the relationship between gold and the U.S. yield curve over the relevant investment period. Our estimation is for a moderate negative relationship to reestablish itself over the next 12 months. If we were to be proven correct and the Fed dropped 2s10s to 50bps in the next year, one would expect to see gold around the $1,923/ounce (oz) level shown above. The nature of using a moderate relationship rather than a strong one to predict a variable is that the predicted value lies within a very wide range; the stronger the relationship (R2 value) the more accurate the prediction.
Conversely, what would one expect gold to sit at given some miracle economic recovery and the yield curve becoming significantly steeper?
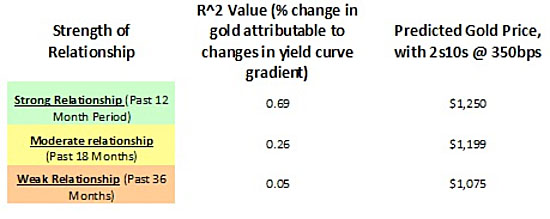
True to intuition a steep yield curve (similar to 2003-2004 peaks) would see gold bottomaccording to our model.
It is important to remember that these scenarios are nothing more than estimates based on simple mathematical models and past data. Models and data carry little weight when dealing with an animal such as the commodities market. With so many variables at play anything could happen. We use these scenarios and examples to help communicate concepts and give our readers an understanding of what it means for gold when a flattening yield curve is observed. In practice and behind the scenes we are definitely not using weak relationship yield curve regressions to predict the gold price.
It is important to reiterate the yield curve is an indicator for the whole economy. For our purposes as a trading service the yield curve isn't the best form of information. It is a reflection of past, present and future expected events. What is of more use to us is present/future-orientated information.
For example, say the Fed hints at QE3 or some other form of easing tomorrow (further easing is very likely to send gold higher); as soon as we receive this news, our outlook on gold changes on the back of the announcement. We do not need to wait to see a flatter U.S. yield curve in the following hours, days or weeks to change our position.
Although we acknowledge the importance of the U.S. yield curve in the determination of the gold price, it is not the most important factor by any stretch. The relationship between gold and the yield curve varies in strength over time, and hence the curves usefulness is somewhat limited. U.S. real rates are a far better predictor and exhibit a much more constant, direct relationship to gold.
The crucial point to take away from this article is it is not economic weakness that drives gold prices higher. It is the policy response to that economic weakness. A weaker economy and flatter yield curve doesnt necessarily mean that gold prices will go higher, but if this is going to be combated by an aggressive easing of monetary policy such as quantitative easing then gold prices will rise significantly. U.S. real interest rates are therefore a more effective indicator for gold prices over the medium term, since they are sensitive to a wider range of policy actions.
There are always multiple factors that drive asset prices in the financial markets and gold is no exception. One has to incorporate a numerous variables in one's analysis in order to formulate a view. The yield curve is just one of these variables and sometimes it gives us valuable insights into future of gold prices, but it cannot be expected to work 100% of the time.
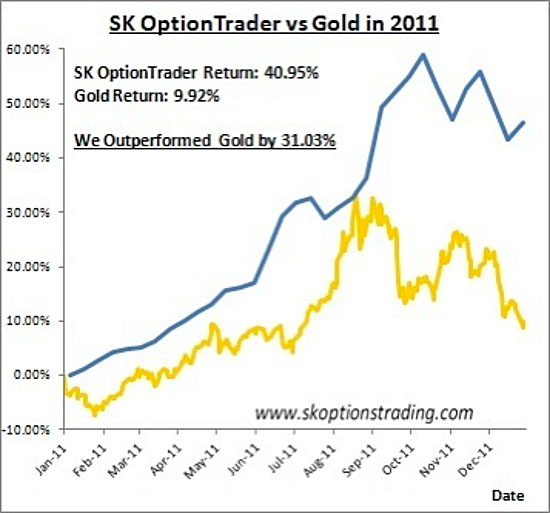
In our analysis we look at numerous factors to form our view on gold prices, with the yield curve being just one of these, and we then execute trades based on these views. Our subscribers get market updates, trading signals and our model portfolio for less than $1 per day. Our model portfolio returned 40.95% in 2011, versus a 9.92% return for gold. We trade options on U.S. markets that can be traded as easily as basic stock options. We now also issue trading recommendations that are not options based but simply use ETFs when we feel that that is the optimal way to execute a trade.
So visit www.skoptionstrading.com for more information and to sign up to our service.
To stay updated on our market commentary, which gold stocks we are buying and why, please subscribe to The Gold Prices Newsletter, completely free of charge. Simply click here and enter your email address.
Sam Kirtley, SK Options Trading
Winners of the GoldDrivers Stock Picking Competition 2007
www.gold-prices.biz
Disclaimer: gold-prices.biz or SK Options Trading makes no guarantee or warranty on the accuracy or completeness of the data provided. Nothing contained herein is intended or shall be deemed to be investment advice, implied or otherwise. This letter represents our views and replicates trades that we are making but nothing more than that. Always consult your registered adviser to assist you with your investments. We accept no liability for any loss arising from the use of the data contained on this letter. Options contain a high level or risk that may result in the loss of part or all invested capital and therefore are suitable for experienced and professional investors and traders only. Past performance is not a guide nor guarantee of future success.