What many analysts are overlooking is the impending daily and intermediate cycle correction that is coming due in the stock market. When the stock market moves down into a cycle low, especially an intermediate cycle low, it generates a tremendous amount of selling pressure. Invariably that selling pressure bleeds into virtually every other asset class, even gold, as you can see in the chart below. Over the last two years there were only two daily cycle corrections in the stock market where gold was unaffected (I've marked them with green arrows).
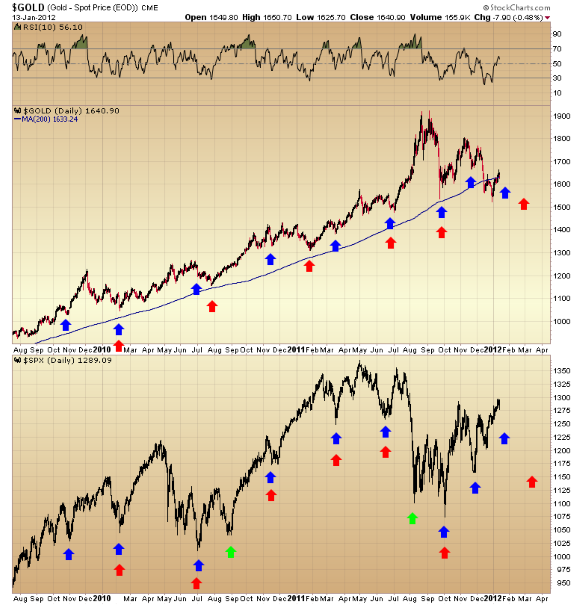
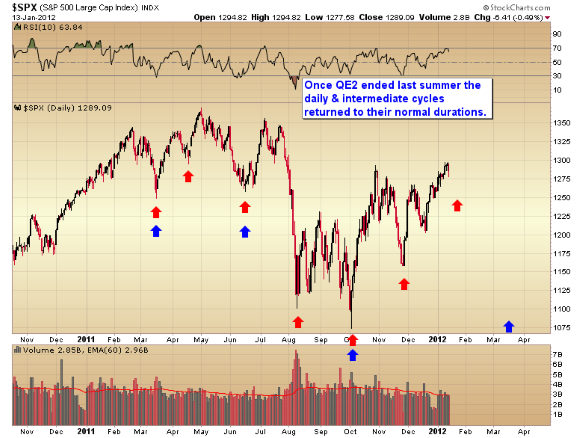
The stock market is now in the timing band for a move down into a daily cycle low. As you can see in the chart below those tend to occur almost like clockwork about every 35 to 40 days. As of Friday the stock market was on day 33. On top of that we have a larger intermediate degree cycle that should bottom sometime in March/April. The selling pressure generated at an intermediate bottom is much more intense than a mere daily cycle low. That means sometime around the middle of March or early April things are going to be looking pretty bleak. My best guess is at that time interest rates will be spiking in France and maybe the UK (along with all of the other countries that are already having debt issues).
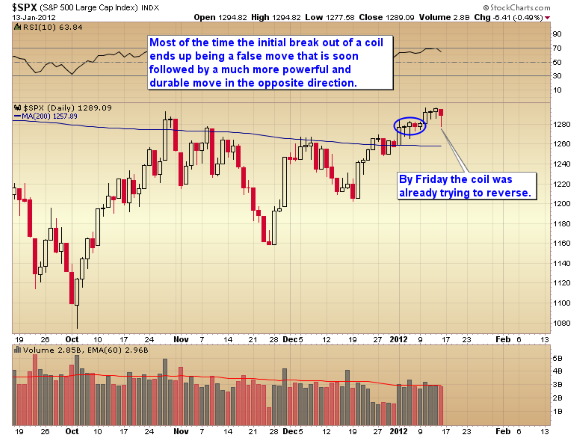
It's late enough in the daily cycle that there is a good chance the market began that move down into its daily cycle bottom on Friday, despite recovering most of the sell off before the close. I say that because we have a coil pattern playing out in the stock market.
Contrary to what most people believe, the initial break out of a volatility coil is usually a false move that is soon followed by a much more powerful and durable move in the opposite direction. In our case the volatility coil broke to the upside and by Friday it was already trying to reverse. Once the stock market moves back through the coil zone it would be very unlikely to recover those levels until after the next intermediate degree bottom, which like I pointed out isn't due until March/April.
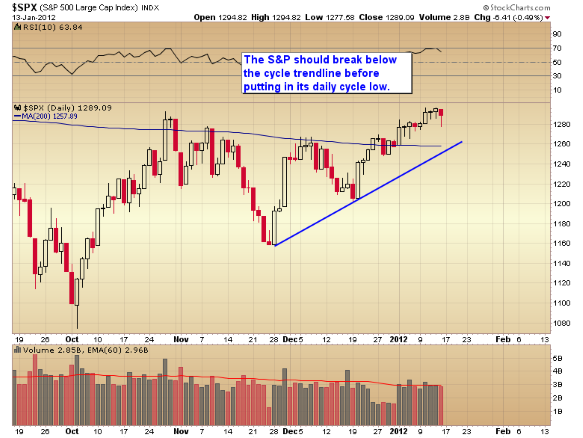
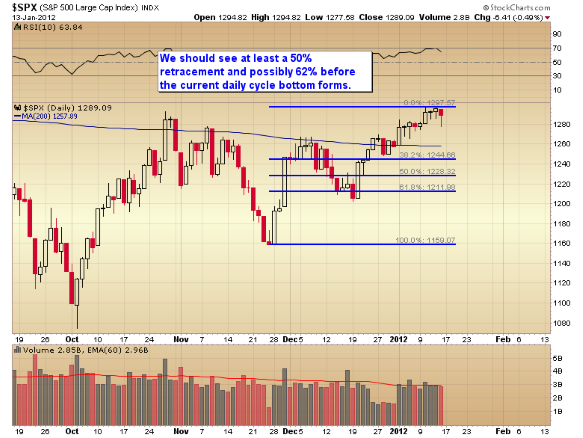
Sometime in the next 4-8 days we should see the stock market break its cycle trend line. It's very rare for a move down into a daily cycle low not to break the cycle trend line. So for our purposes I think we can probably assume that it will.
If the stock market just retraces 50% of the daily cycle advance (assuming 1297 is the top) then we should see a pretty hefty sell off in the next week or two.
That kind of selling pressure will almost certainly have some affect on gold. If the D-Wave is still in progress it's going to have a sharp affect on gold, probably forcing gold back below the $1523 December bottom. How gold handles the stock market moving down into its daily cycle low will give us a big clue as to whether the D-Wave has bottomed or not.
And even stiffer test is going to occur as the stock market moves down into its intermediate bottom in March/April. If gold can't hold above $1523 as stocks move into a daily cycle low then it is going to get driven much lower during the intense selling pressure that will be generated when stocks move down into a larger degree intermediate bottom.
A couple of things to keep in mind.
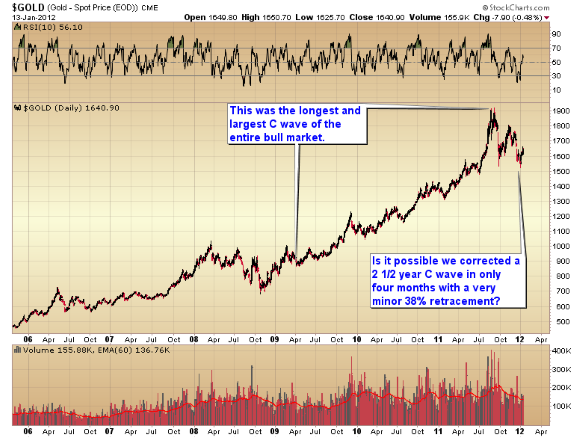
The last C-wave was the greatest in both magnitude and duration of the entire secular bull market. Is it possible that a 2 1/2 year, 100%+ rally can be corrected with only a 38% retracement in four short months?
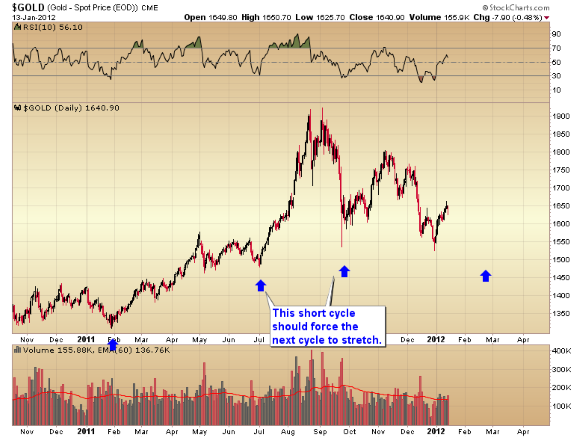
There is also the problem with the last intermediate cycle in gold running very short at only 13 weeks (normal duration is about 20-25 weeks). More often than not a short cycle is followed by a long cycle that evens out the next larger cycle. In this case the next larger cycle would be the yearly cycle.
If December 29th did mark an intermediate bottom then we would've had two intermediate cycles of only 13 weeks each. A short cycle followed by another short cycle is a pretty rare occurrence. In this case exceptionally so because the yearly cycle low isn't do until February/March. If I take into account nothing else I would have to assume that gold still has about 5 to 6 more weeks before the final D-Wave and yearly cycle low are formed.
That doesn't mean that gold has to drop a considerable distance below $1523. If it does turn out that gold continues lower into a more normal intermediate timing band I doubt that gold would move below the 50% Fibonacci retracement level, which is at about $1400. That also corresponds with the extensive consolidation zone in the summer of 2010.
One other thing to consider is the powerful correlation of a stronger dollar whenever the stock market moves down into a cycle low. We should continue to see the dollar spike higher over the next couple of weeks as the stock market drops down into its daily cycle trough, followed by a much more powerful rise during the intermediate degree decline due later in the spring. As you can see in the chart below gold has had little ability to resist a rising dollar.
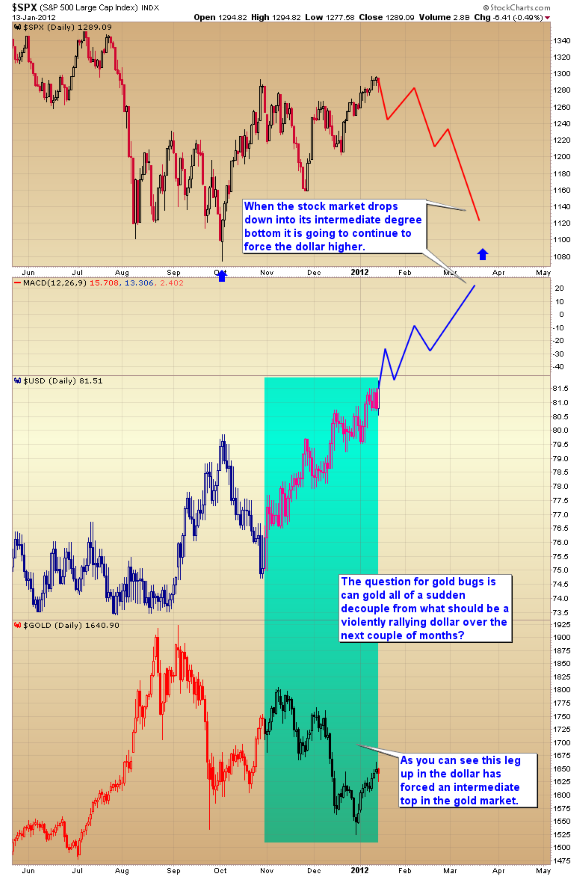
So unless you think that the stock market will never drop down into a cycle low again, or that the market and the dollar will drop simultaneously (very unlikely), then gold is going to be severely tested as the dollar spikes sharply higher during the next few weeks and months as the stock market works its way down into first, a daily cycle low, and then a much more serious intermediate degree correction.
Right now investors need to be on the sidelines while we wait to see how gold handles the stock market's move down into its daily cycle low. If gold can hold above $1523 while the stock market suffers what is likely to be a rather sharp correction then the odds will improve dramatically that the D-Wave did in fact bottom in December.
If however gold follows the stock market down and breaches that $1523 pivot then the odds are very high that the D-Wave is still in progress and will not bottom until late February/mid-March.
I am currently still running the one week, $10 introductory offer for the SMT premium newsletter. Since we should see the stock market form its daily cycle low sometime in the next 1-2 weeks now would be a perfect time to sample the newsletter.
Toby Connor, Gold Scents